All Work
Case Study · BuildingMinds

Building Minds

Role
Lead UX/UI Designer
Type
PropTech · Enterprise
Timeline
2019 – Present
Team
5 Designers · 20+ FE · 20+ BE · 5+ Data Analysts · 5 PM
Tools
Claude · Figma · FigJam
My Role

Foundational design hire

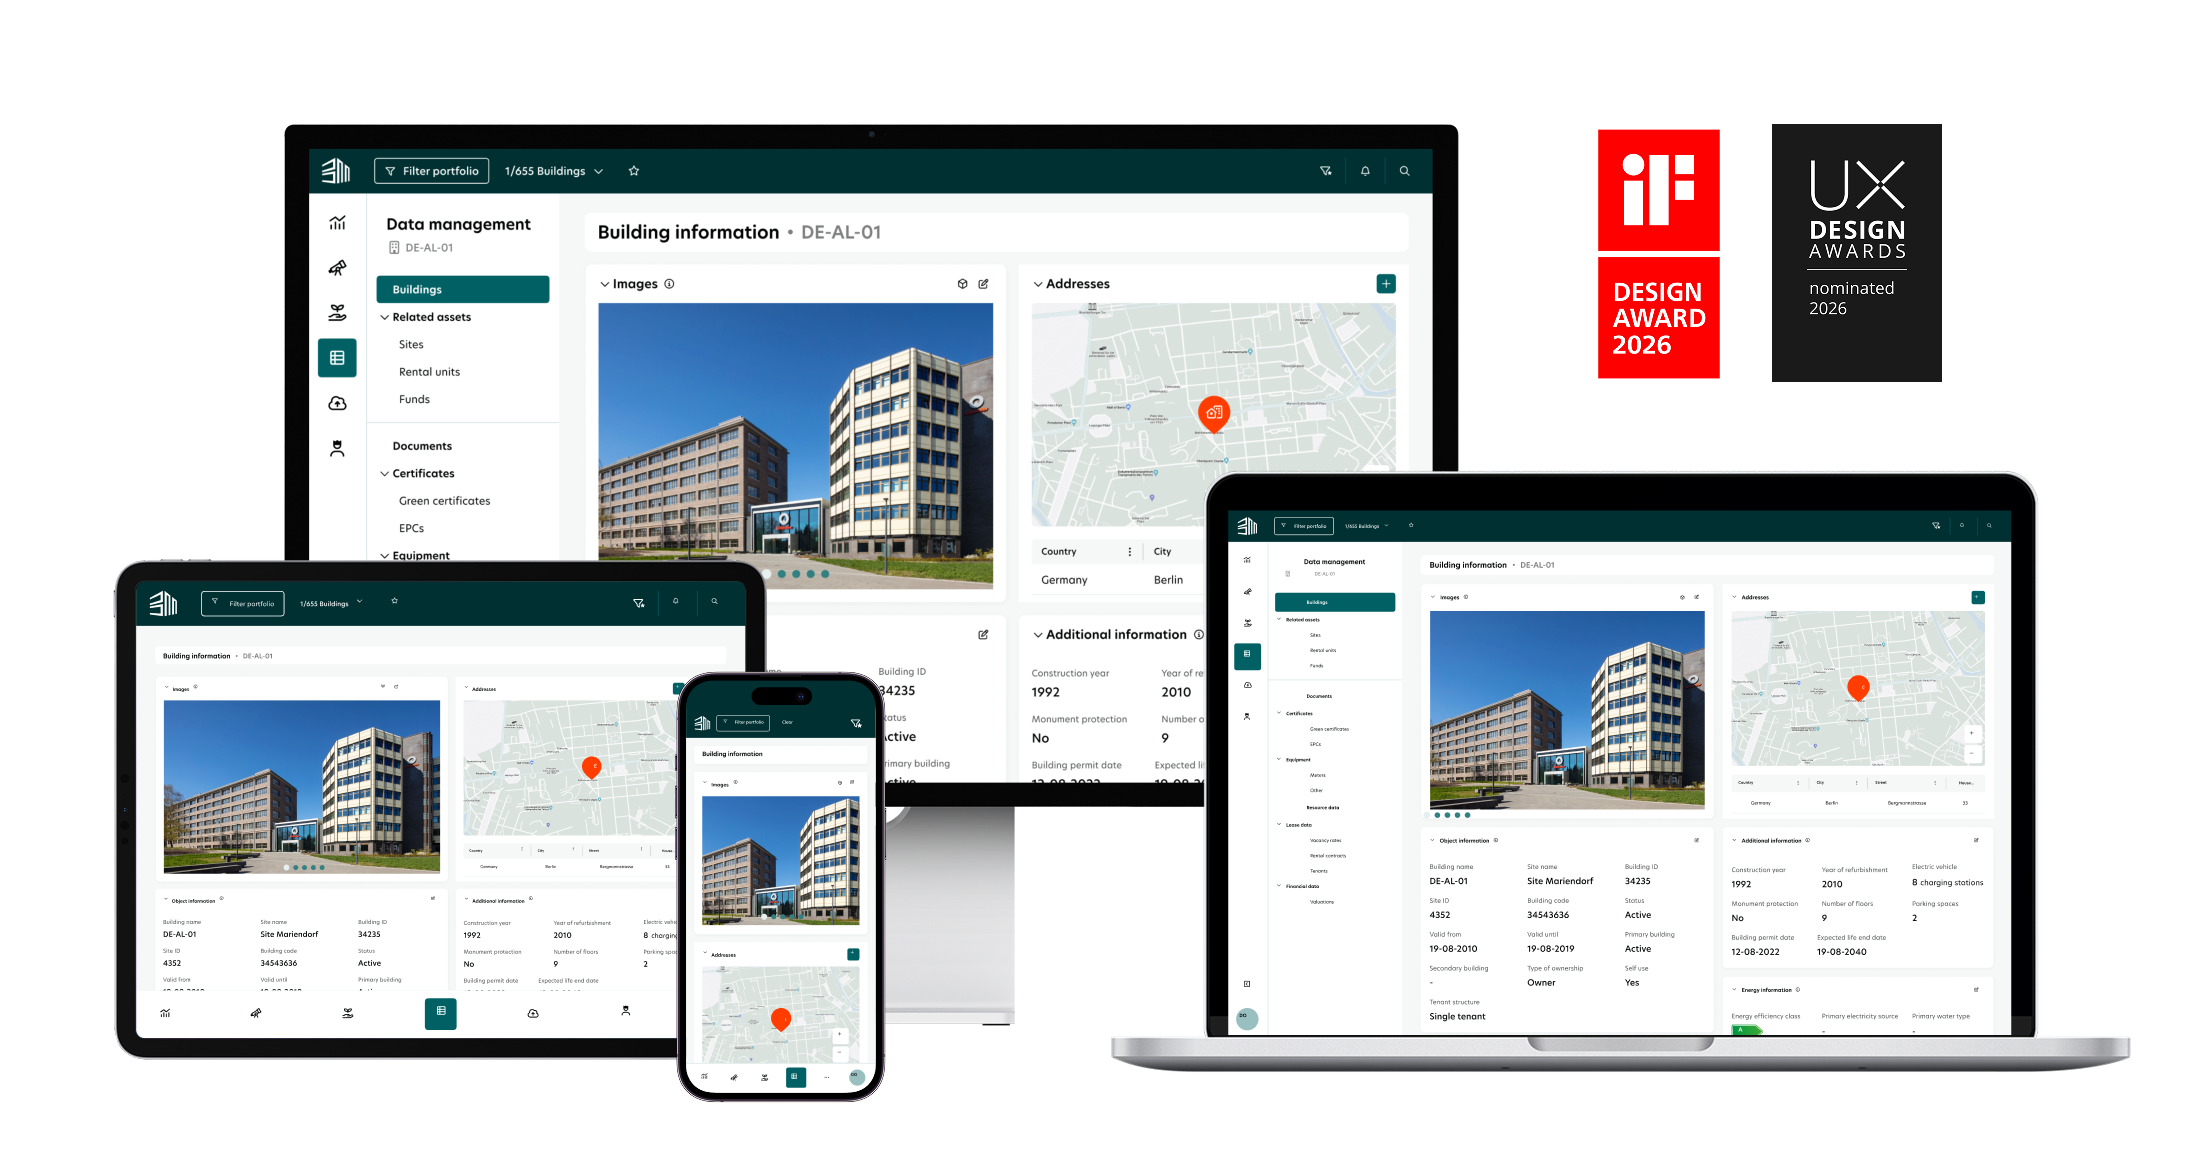
Joined BuildingMinds as a foundational design hire, shaping how design operates across the product — not just what it looks like. Over six years, I led the design of the platform's core intelligence layer, built the design system from scratch, and embedded user-centered thinking into every stage of the build.

01
Design System & Mentorship
Built the company's design system from scratch, trained and mentored junior designers, and created a shared visual language that scaled across product teams and multiple regulatory domains.
02
Cross-Functional Partnership
Established deep working relationships with engineering, product, data, and commercial teams to ensure design was embedded at every stage — from early discovery through to production release.
03
User-Centered Design
Championed the user perspective in a data-heavy domain, balancing the needs of portfolio managers, sustainability officers, and regulators — translating complex compliance requirements into intuitive, trustworthy workflows.

"Real estate accounts for 40% of global CO₂ emissions. Most portfolio managers still track sustainability targets in spreadsheets."

The core tension that shaped every design decision

We're reframing sustainability as a design opportunity, not a compliance burden. BuildingMinds builds the intelligence layer for real estate — aggregating performance data across entire portfolios and translating it into clear, actionable benchmarks that asset managers can confidently act on.

I led design on the platform's core ESG modules: portfolio benchmarking, building deep-dives, carbon tracking, and compliance reporting. The product serves portfolio directors, sustainability officers, and asset managers at some of Europe's largest real estate funds.

Every building is different, making it hard to compare performance or set meaningful standards across a portfolio. Sustainability data lived in disconnected systems, reporting was largely manual, and regulatory pressure was accelerating faster than existing tooling could handle.

The compliance gap was growing. EU Taxonomy, SFDR and the GHG Protocol demanded disclosure levels that existing infrastructure couldn't support — turning what should be a strategic advantage into a source of organizational anxiety for finance and sustainability teams alike.

Our Approach

Three connected design challenges, one platform. We unified fractured sustainability data under consistent models with provenance tracking, built role-based views so each stakeholder sees exactly the right level of detail, and turned multi-week compliance reporting cycles into guided, auditable workflows that regulators could trust.

01
Unifying Fractured Data
Bringing energy, carbon, certifications, and regulatory status into a single platform — with consistent data models, provenance tracking, and confidence scores, so teams could finally trust the numbers they acted on.
02
Connecting Stakeholders
Designing role-based views so portfolio managers, sustainability officers, and building managers each see the layer of detail they need — from portfolio-level benchmarks to asset-level deep dives — without information overload.
03
Simplifying Reporting
Turning multi-week manual compliance cycles into guided, auditable workflows. ESG disclosures that previously took sustainability teams two weeks now complete in days, with full traceability built in for regulators and auditors.
Research

Talking to the people living the problem

We ran 14 stakeholder interviews across portfolio managers, sustainability officers, and asset directors — supplemented by co-design workshops and competitive analysis across 8 ESG/proptech platforms. Six findings shaped the entire design direction.

01
Data trust, not data volume
Users didn't question how much data they had. They questioned whether to trust it. Accuracy concerns blocked confident decision-making more than any missing feature.
02
Context beats raw numbers
A building consuming 180 kWh/m² means nothing in isolation. Portfolio managers needed relative performance benchmarked against sector averages, peers, and regulatory targets.
03
Action-oriented, not informational
Every dashboard we audited failed the same way: too much information, no clear next step. Users needed answers to "what should I do?" not a comprehensive view of everything.
04
Reporting is a team sport
ESG disclosures touched 4–6 stakeholders per cycle, each with different data access and accountability. Siloed tools created bottlenecks and version-control chaos every reporting period.
05
Regulation as a design constraint
EU Taxonomy, SFDR, and GRESB each use different data models. Sustainability officers needed a single interface that understood all three frameworks without duplicating data entry.
06
Terminology varies by role
A "stranded asset" means something different to a portfolio manager vs. a sustainability officer. The interface needed to adapt language per role without creating a glossary problem.
Design Goals

Three principles that guided every decision

GOAL 1
Build trust before insight
Before a user acts on data, they need to trust it. Every metric in the platform shows its source, vintage, and confidence level — making provenance a first-class design element, not an afterthought.
GOAL 2
Role-appropriate depth
A portfolio director doesn't need building-level sensor data on their daily dashboard. Each persona gets a view calibrated to their decision-making frequency and depth — with progressive disclosure for when they need to go deeper.
GOAL 3
Compliance through clarity
Regulatory frameworks are unavoidably complex. Our job wasn't to hide that complexity — it was to structure it so users always knew where they stood, what was missing, and exactly what to do next.
User Personas

Designing for three distinct mindsets

01
Primary User
The Portfolio Manager
Responsible for the strategic performance of a real estate fund across 50–500 buildings. Needs portfolio-level visibility to make investment and divestment decisions. Doesn't have time for building-level detail on a daily basis.
Key pain points
No single view of portfolio-level sustainability performance
Benchmarking requires manual data extraction across systems
Cannot quickly surface which buildings are ESG risks
02
Secondary User
The Sustainability Manager
The compliance and reporting specialist. Accountable for annual SFDR and EU Taxonomy disclosures. Works deeply with data but needs to communicate clear, defensible insights to non-technical stakeholders at board level.
Key pain points
Manual report compilation takes weeks per cycle
Data quality inconsistencies create audit risk
No audit trail for regulatory disclosures
03
Tertiary User
The Building Manager
Manages individual buildings or regional clusters. Needs to understand the sustainability trajectory of specific assets and how they contribute to, or drag on, portfolio-level targets.
Key pain points
Building data is fragmented across facilities tools
Hard to contextualise a building's performance against benchmarks
No early warning system for stranded asset risk
User Journey

Five stakeholders, one shared workflow

Setup & Ingestion
Portfolio Assessment
Scenario Planning
Compliance Review
Reporting & Sign-off
Portfolio Manager
Sustainability Officer
Operations Manager
Data Admin
Automated System
Active involvement
Background / monitoring
Key touchpoint
Shaping the Experience

Shaping user-centered reporting

With research complete, design work began with the core reporting flows — the workflows that sustainability teams live in daily. Rather than starting with features, we mapped what decisions users actually needed to make and worked backwards to the interface.

Early explorations focused on surface-level clarity: how to present complex regulatory data without overwhelming the user, and how to build enough context that managers could act confidently without needing to be experts in every compliance framework.
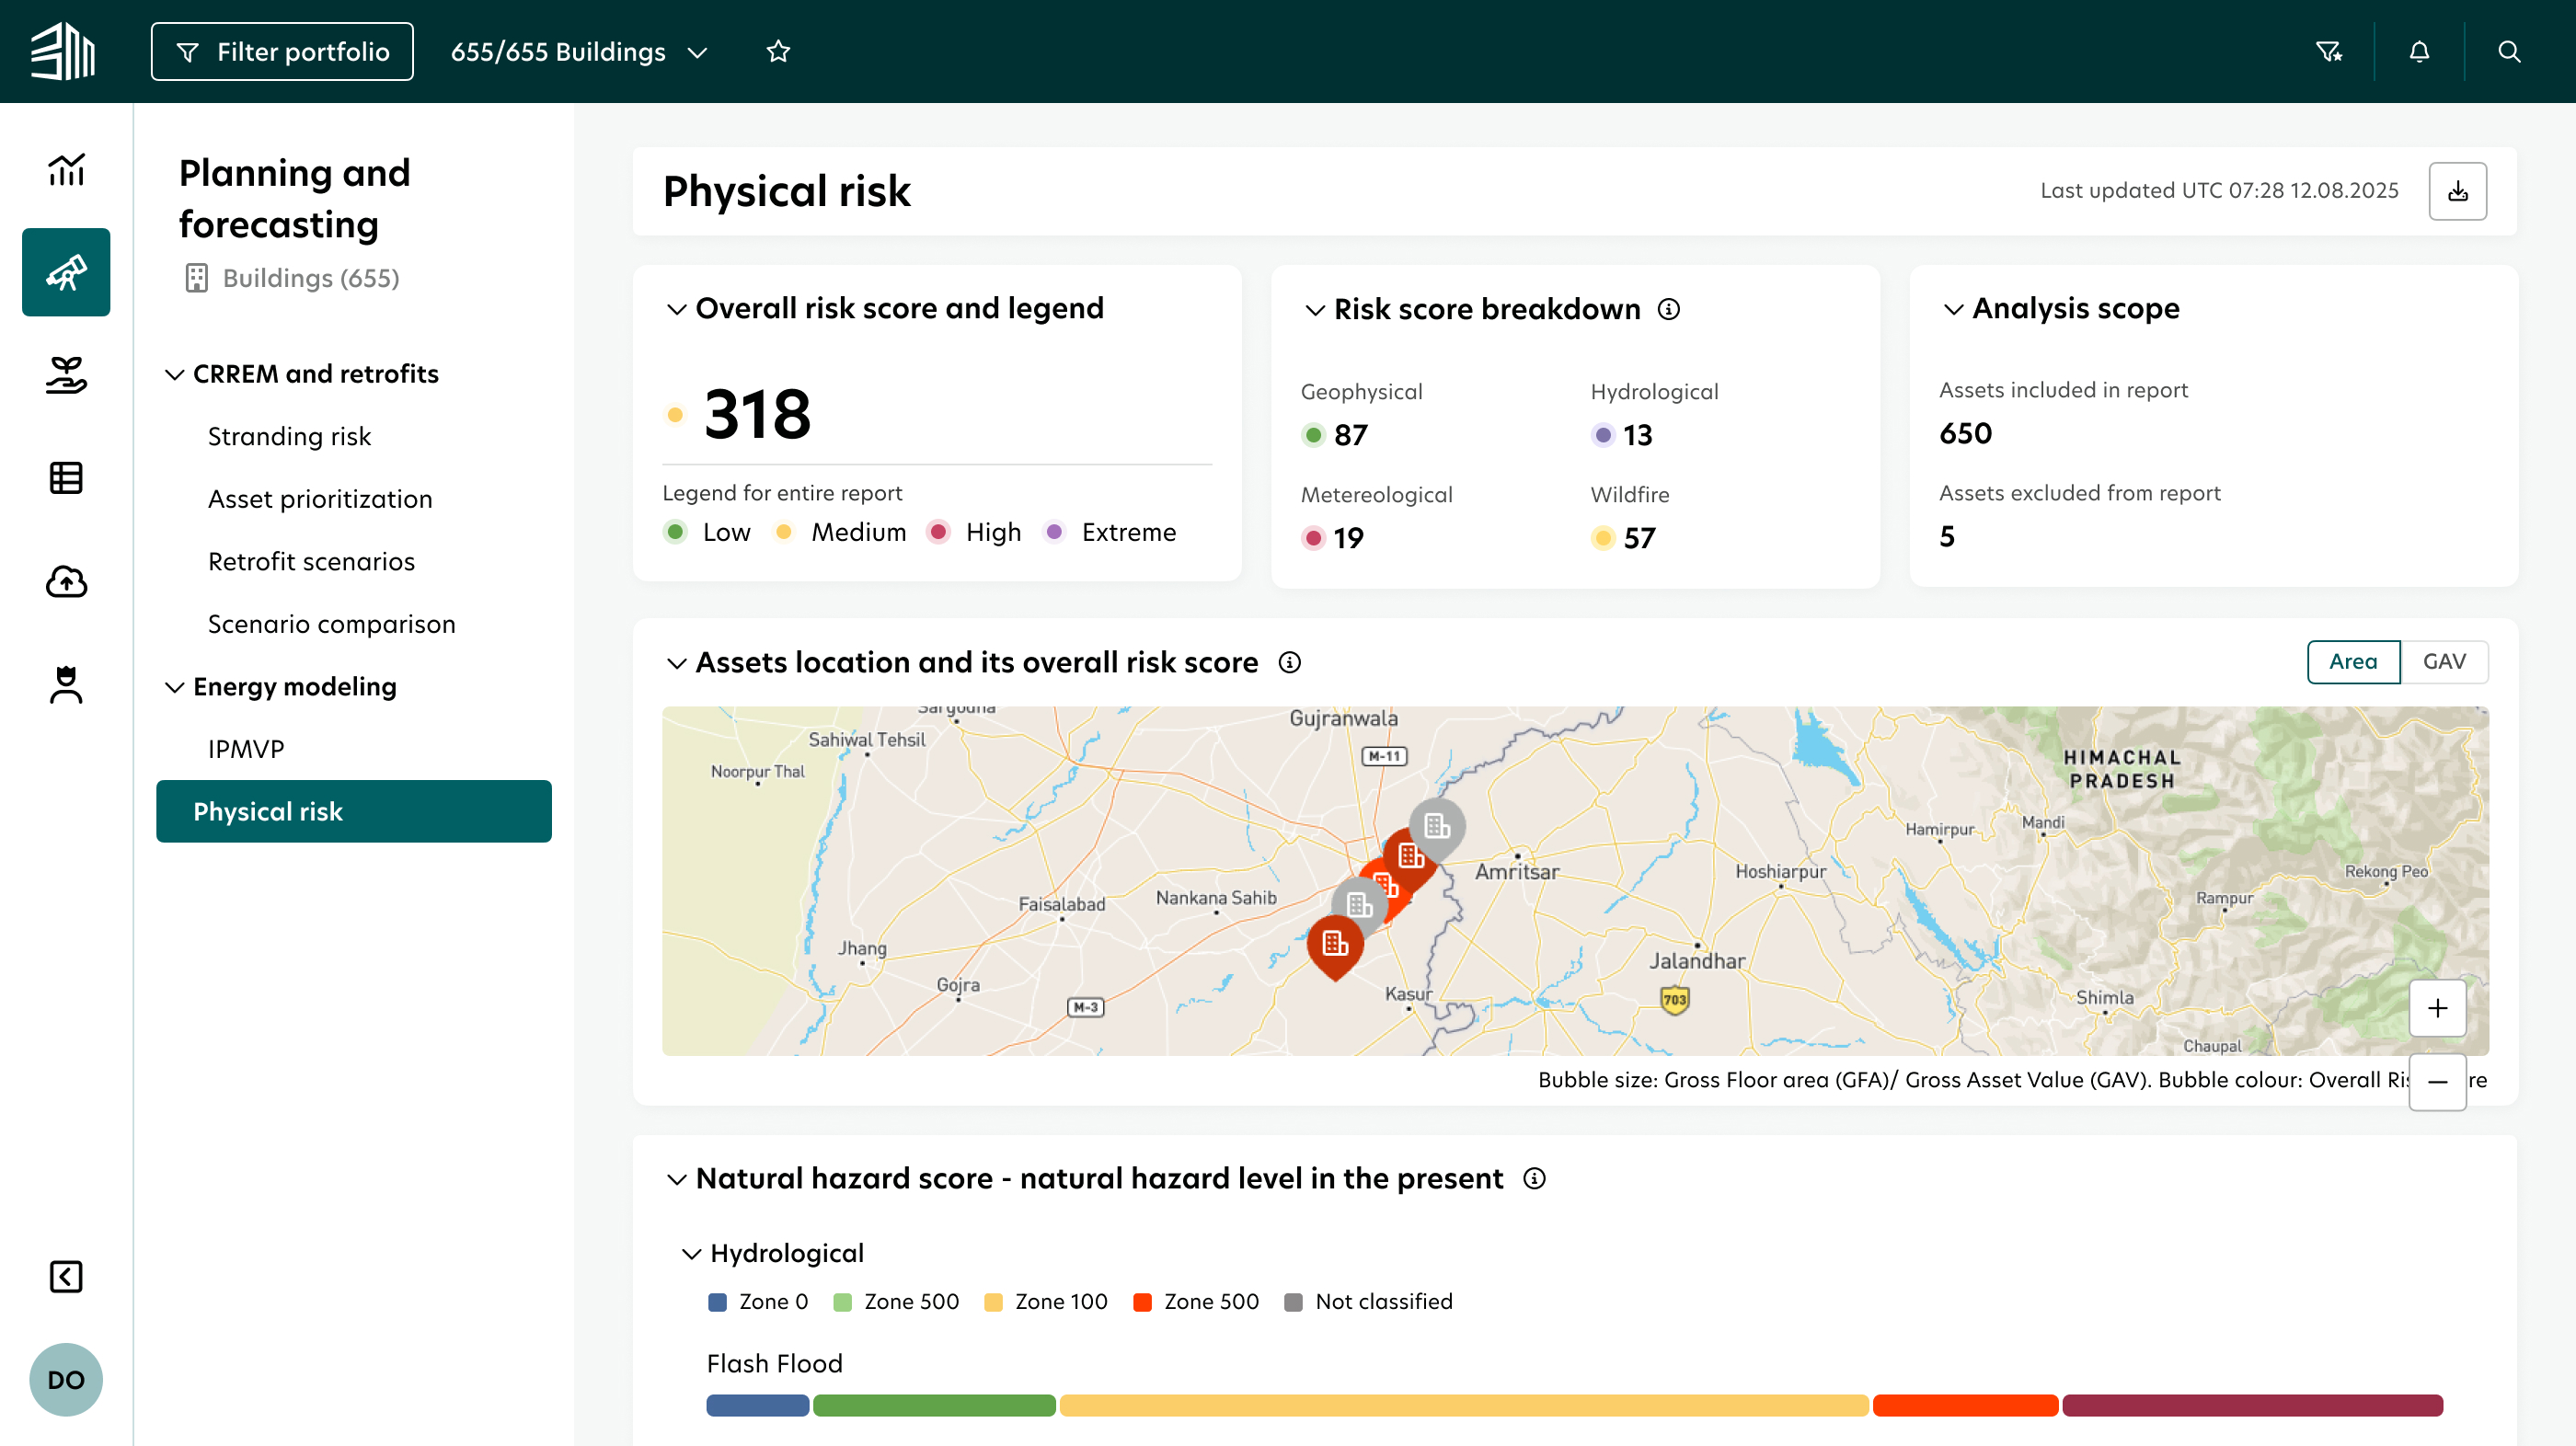
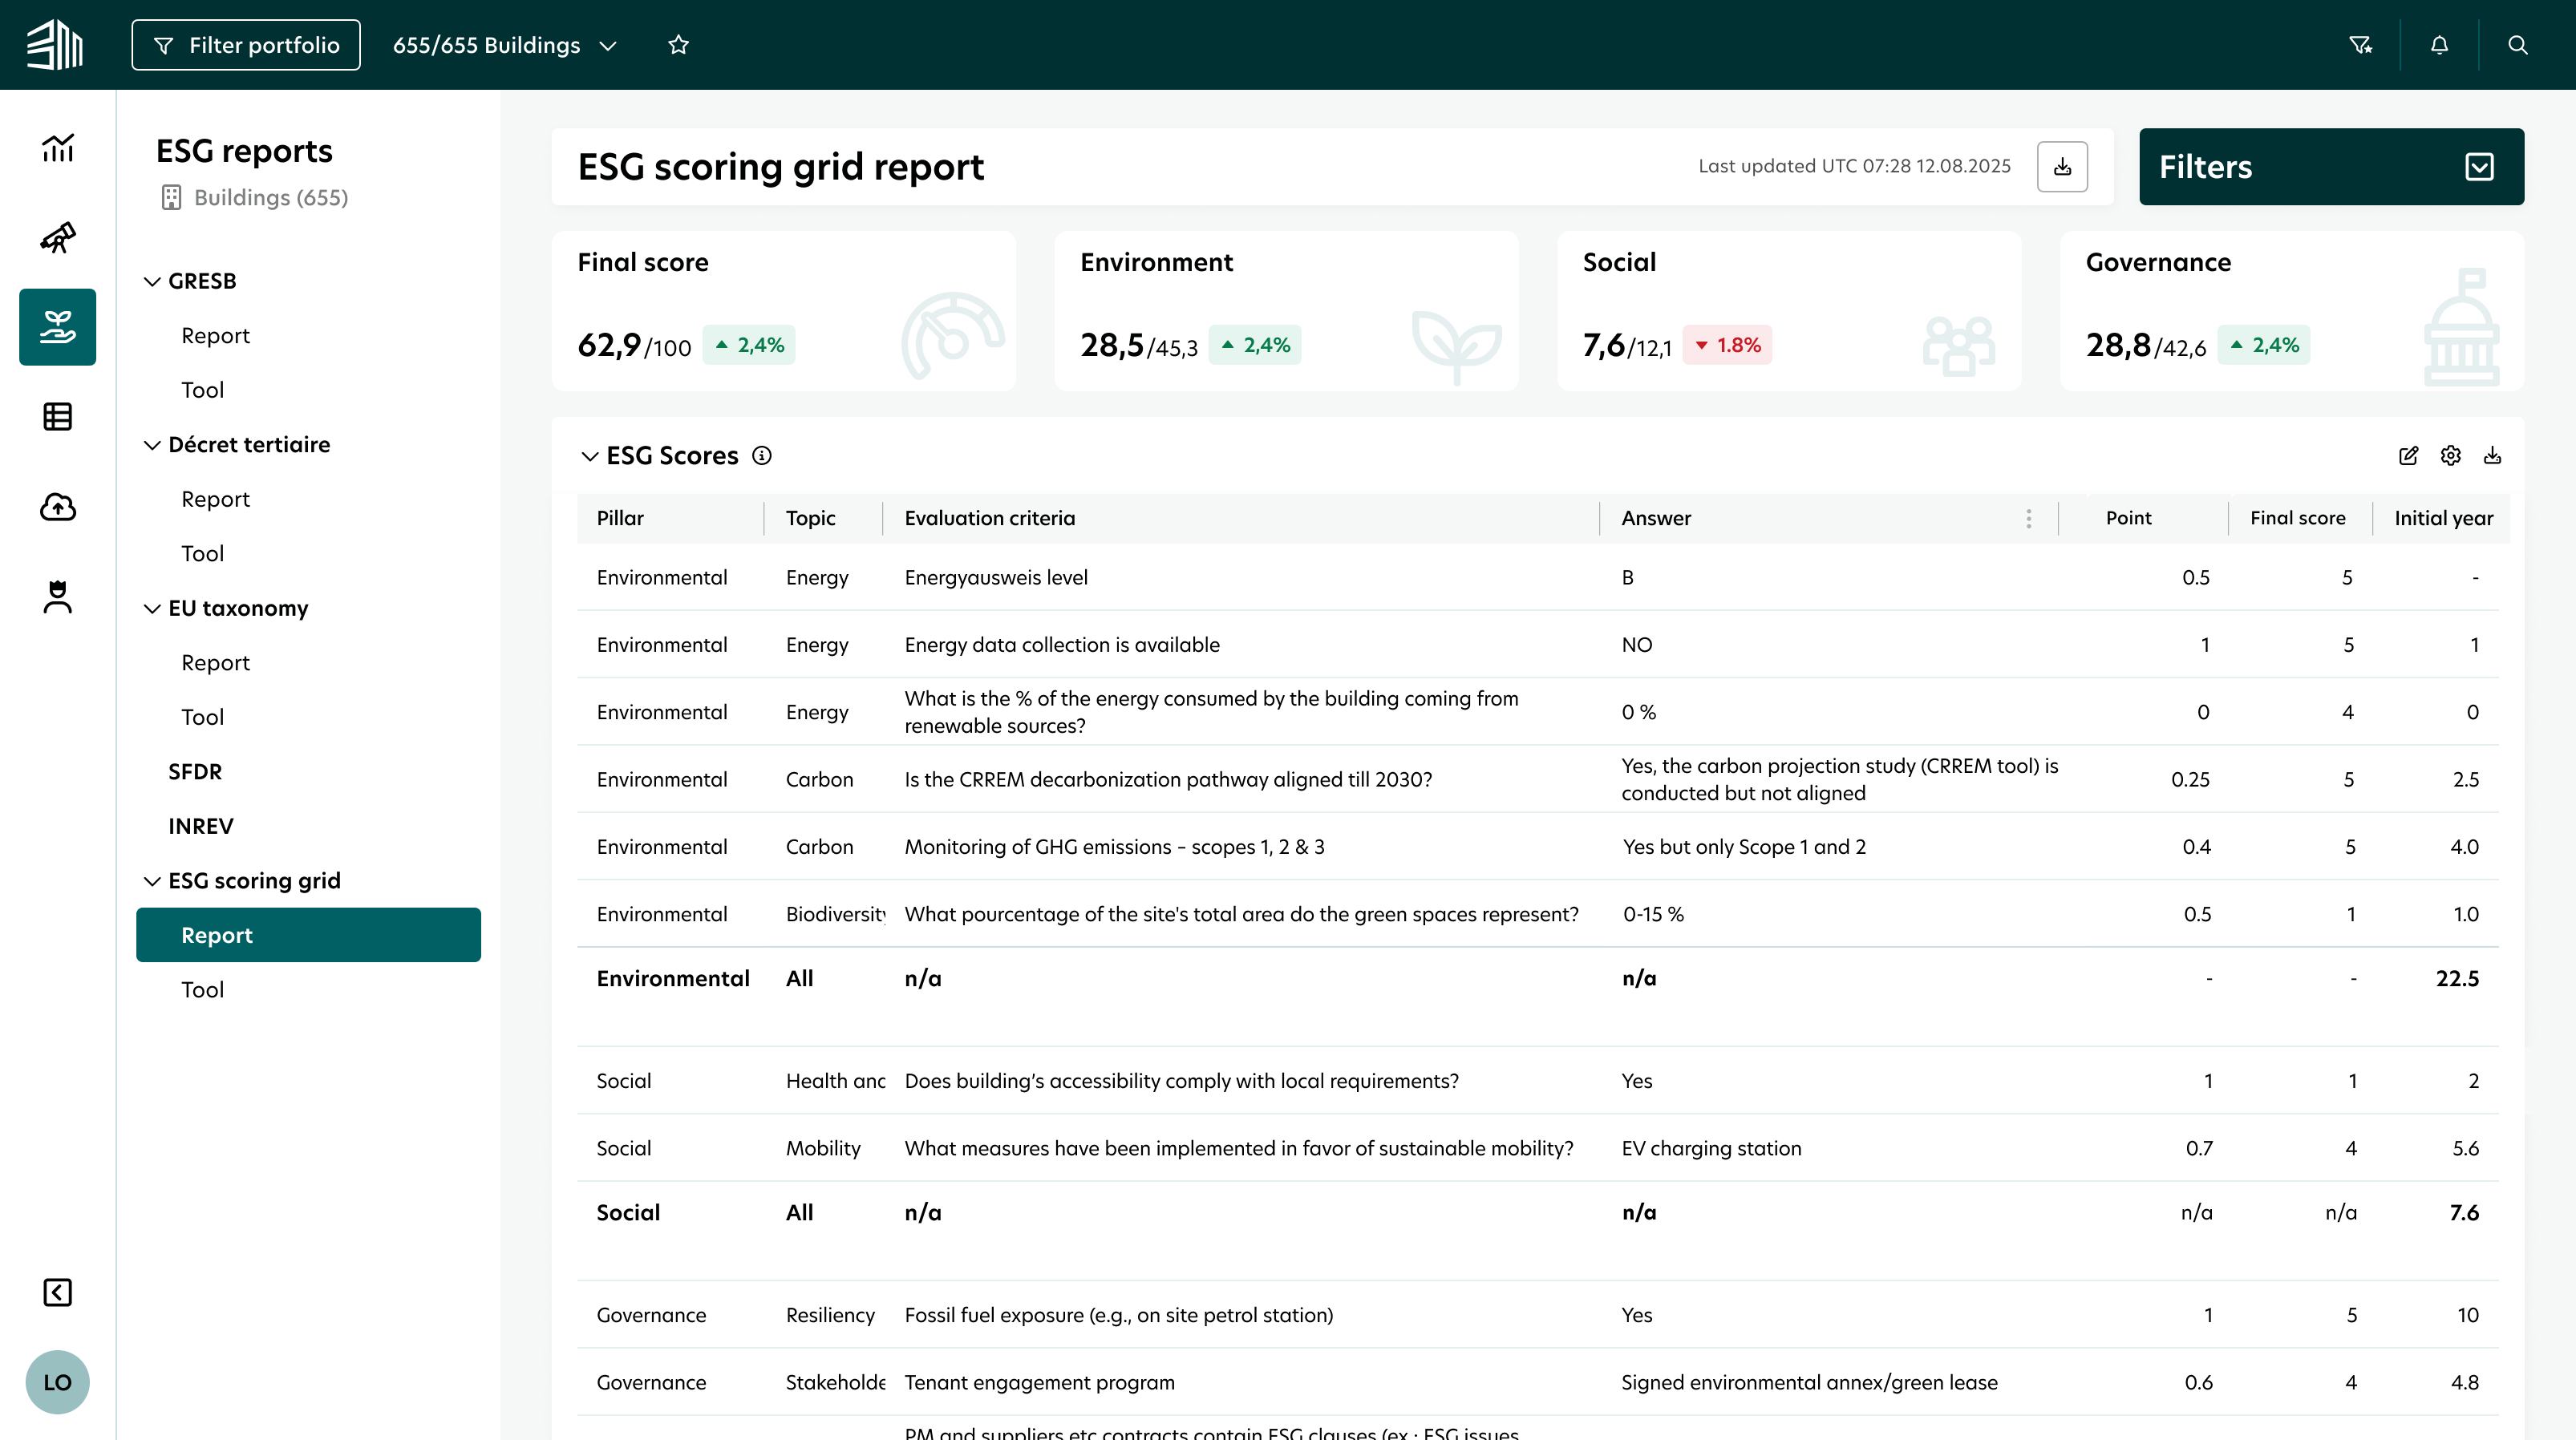
Physical risk mapping
ESG scoring grid
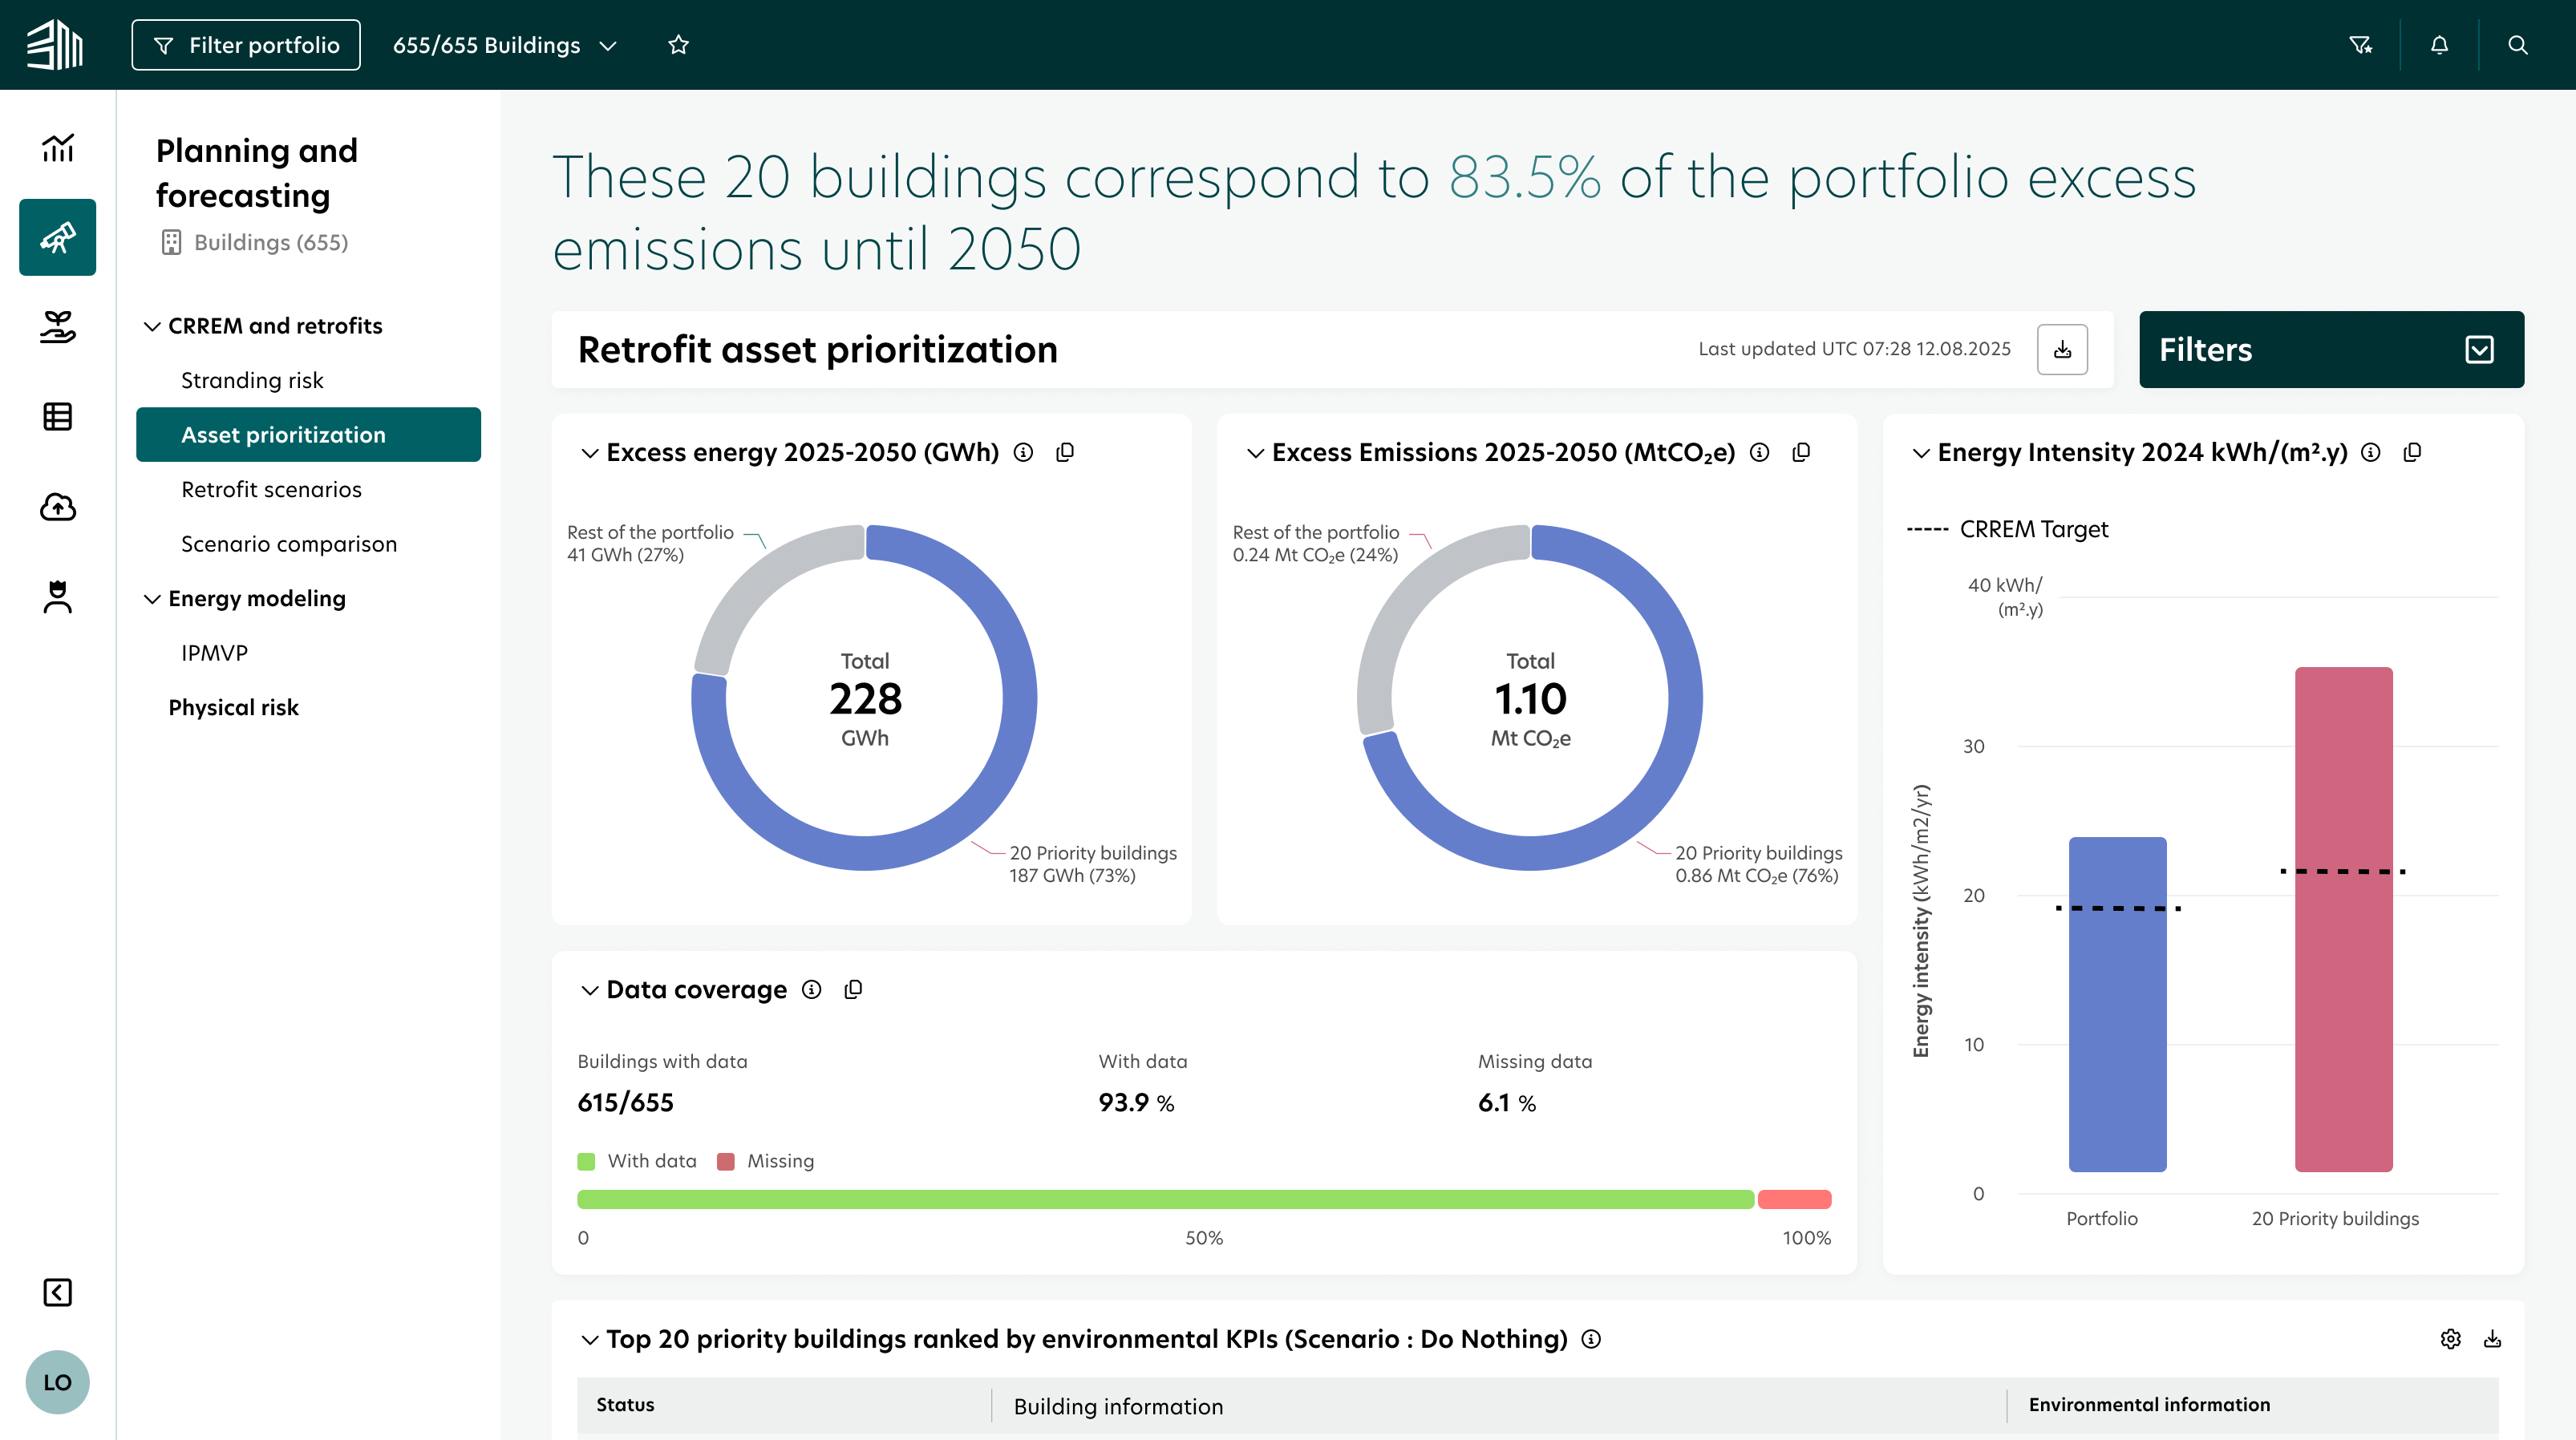
Retrofit asset overview
AI Experience Design

Building intelligence into the workflow

Two of the most impactful features on the platform were built around AI — and both required rethinking what AI interaction looks like for enterprise users who need to trust every number they sign off on.

From data to recommended action

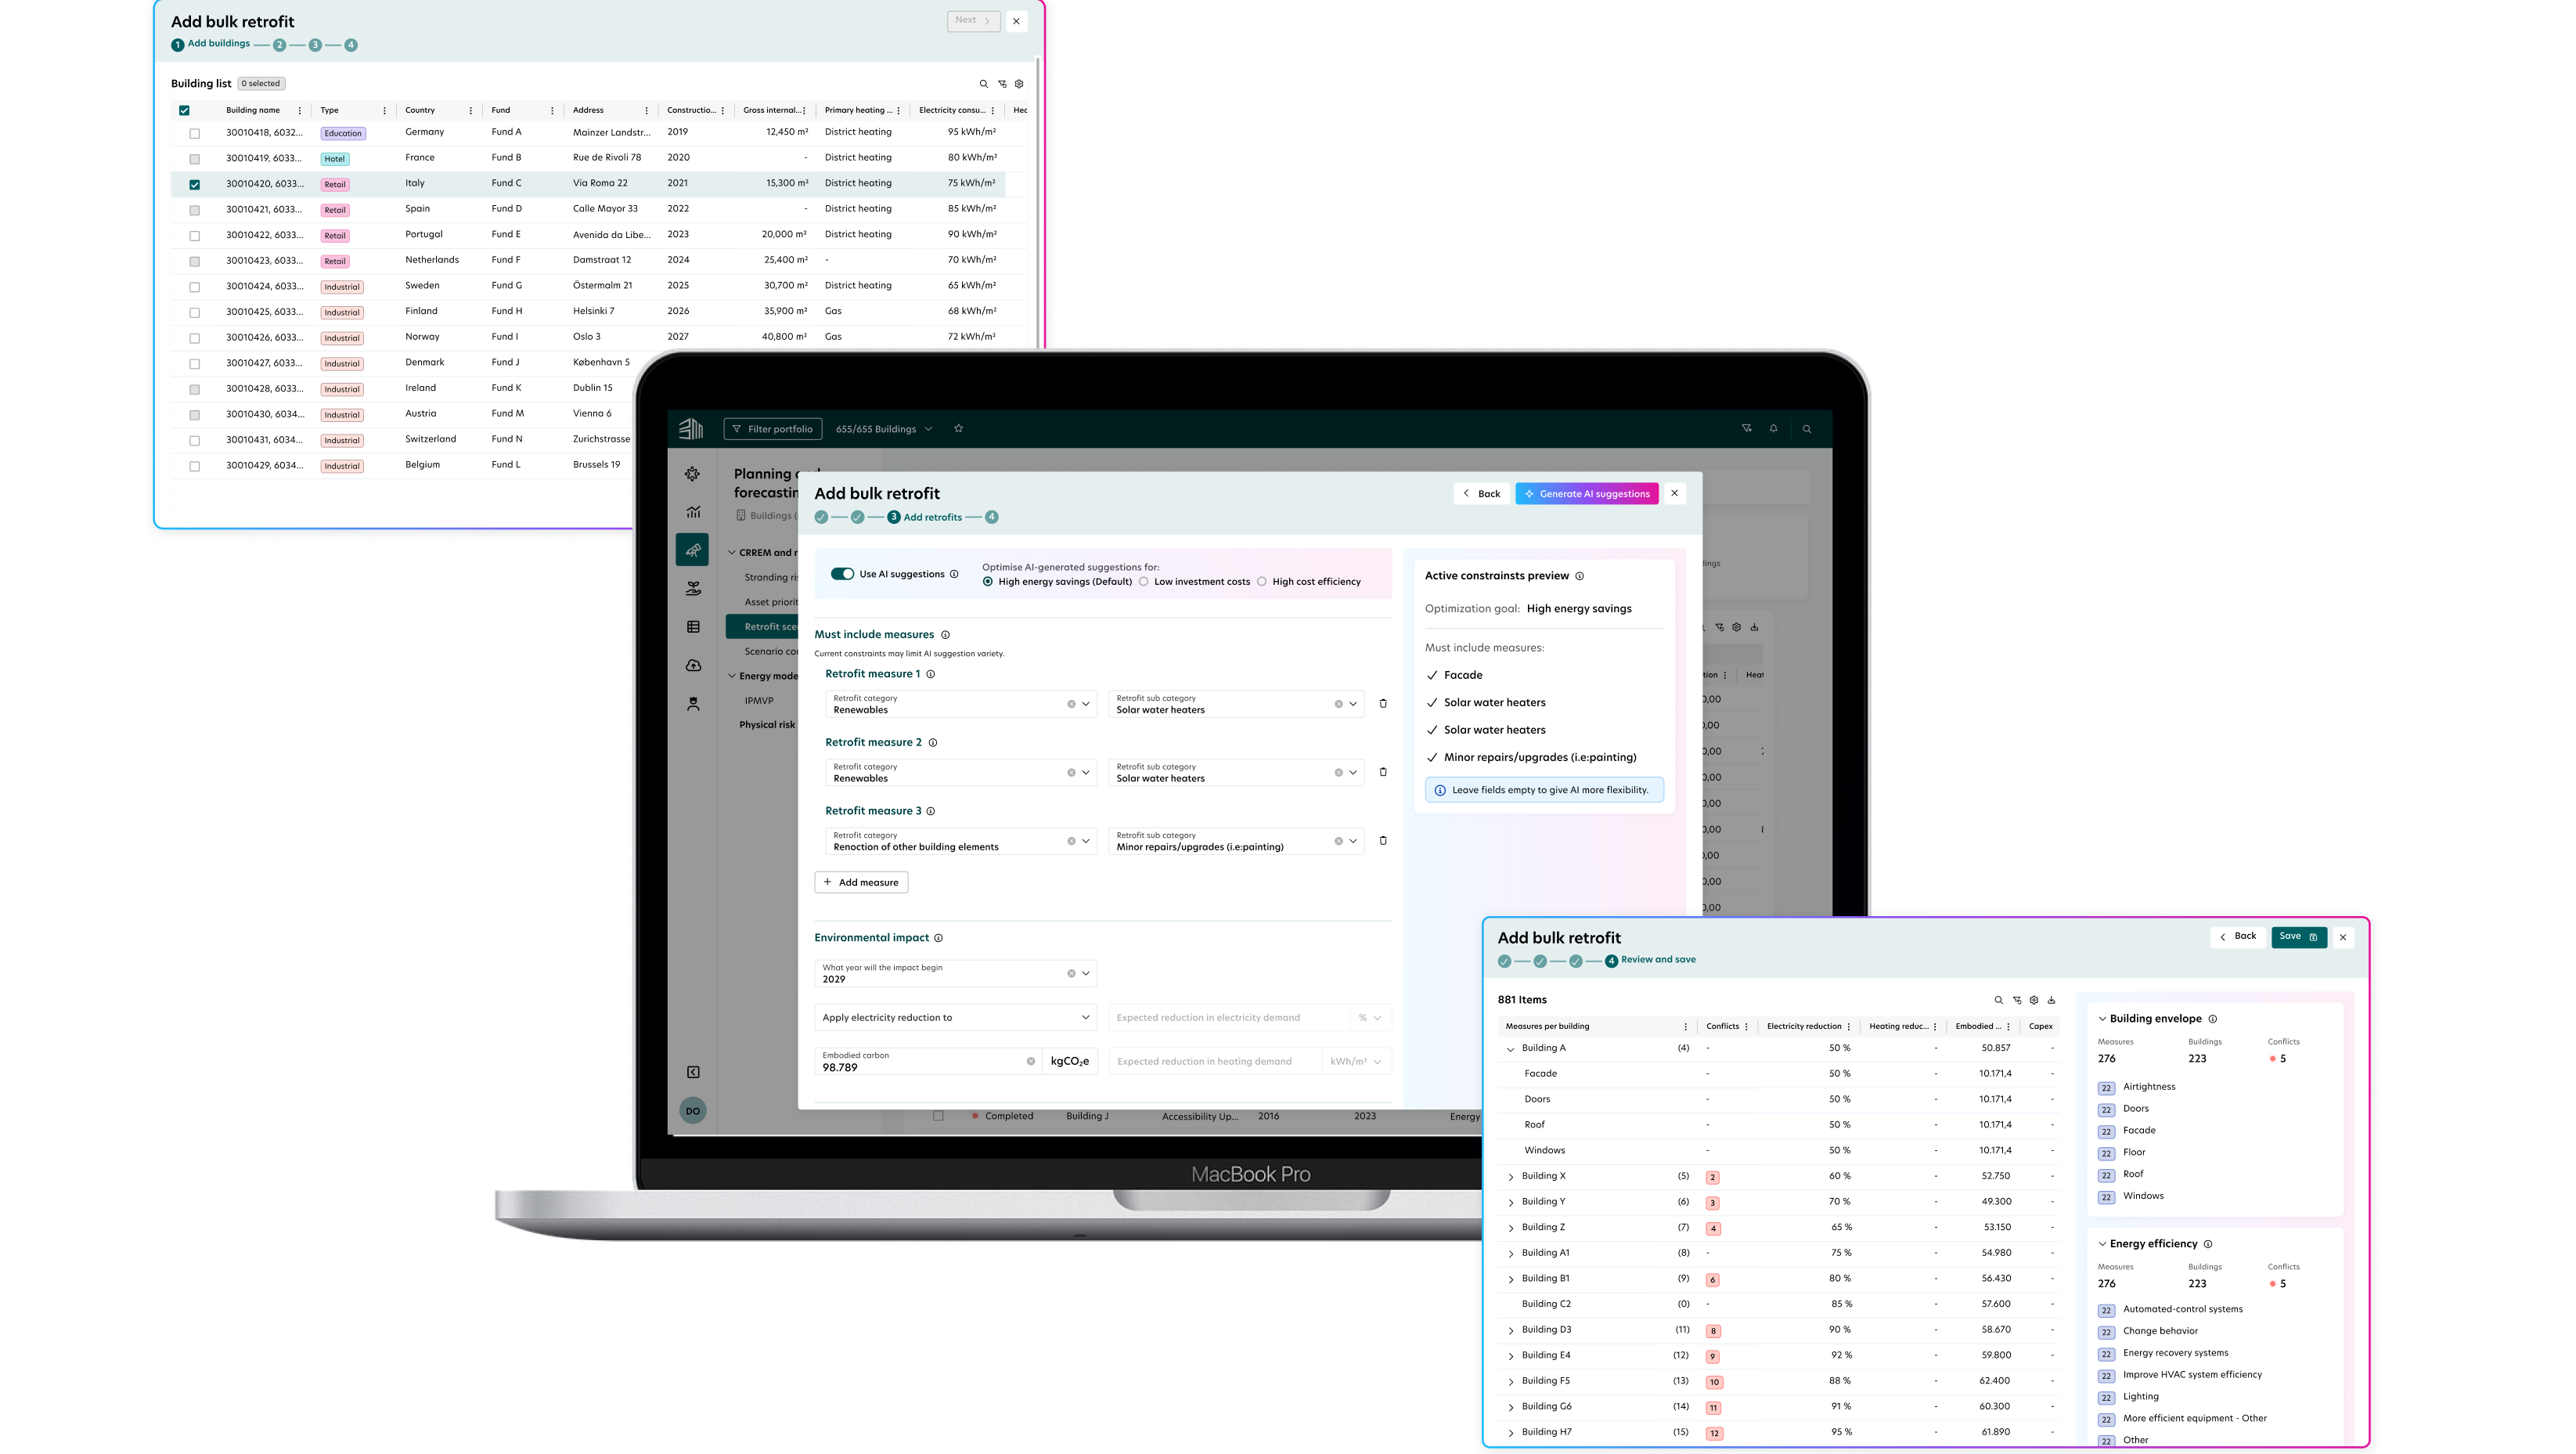
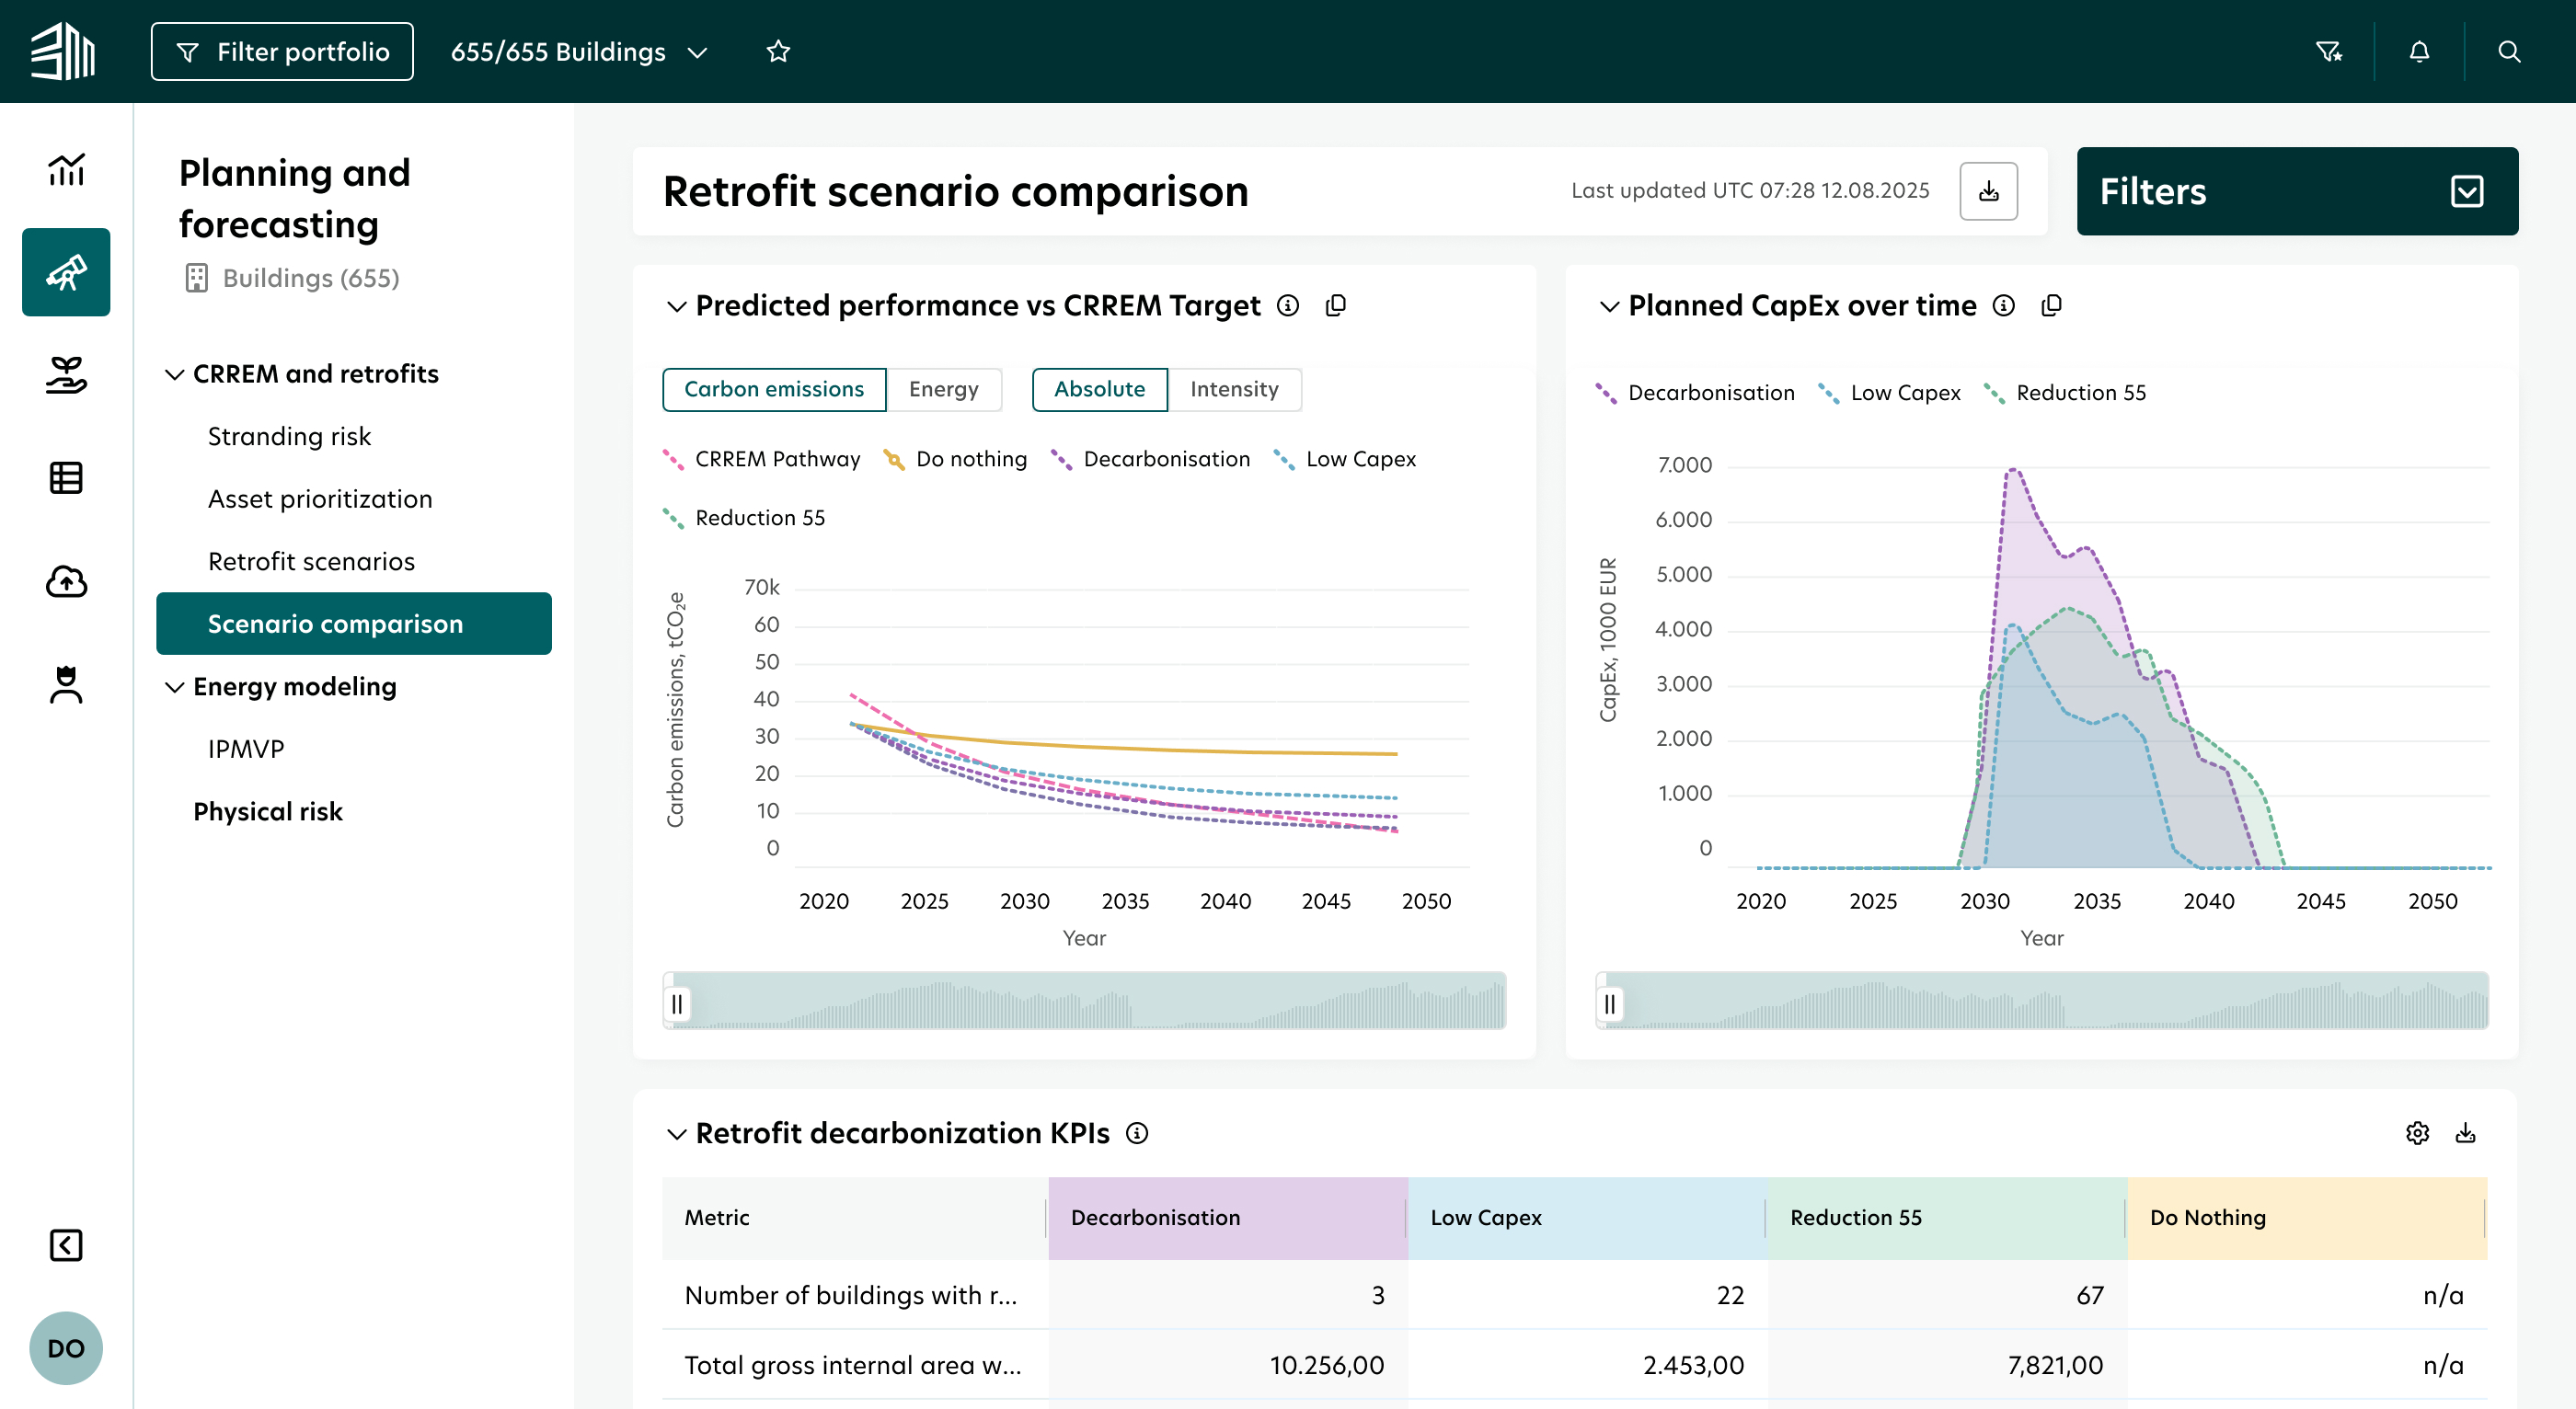
Rather than presenting raw performance scores, the platform uses AI to translate building data into prioritized retrofit recommendations — surfacing which interventions deliver the best carbon reduction relative to cost.

Each suggestion comes with a confidence rating and data provenance, so sustainability officers can trace every recommendation back to the underlying sensor or invoice data.
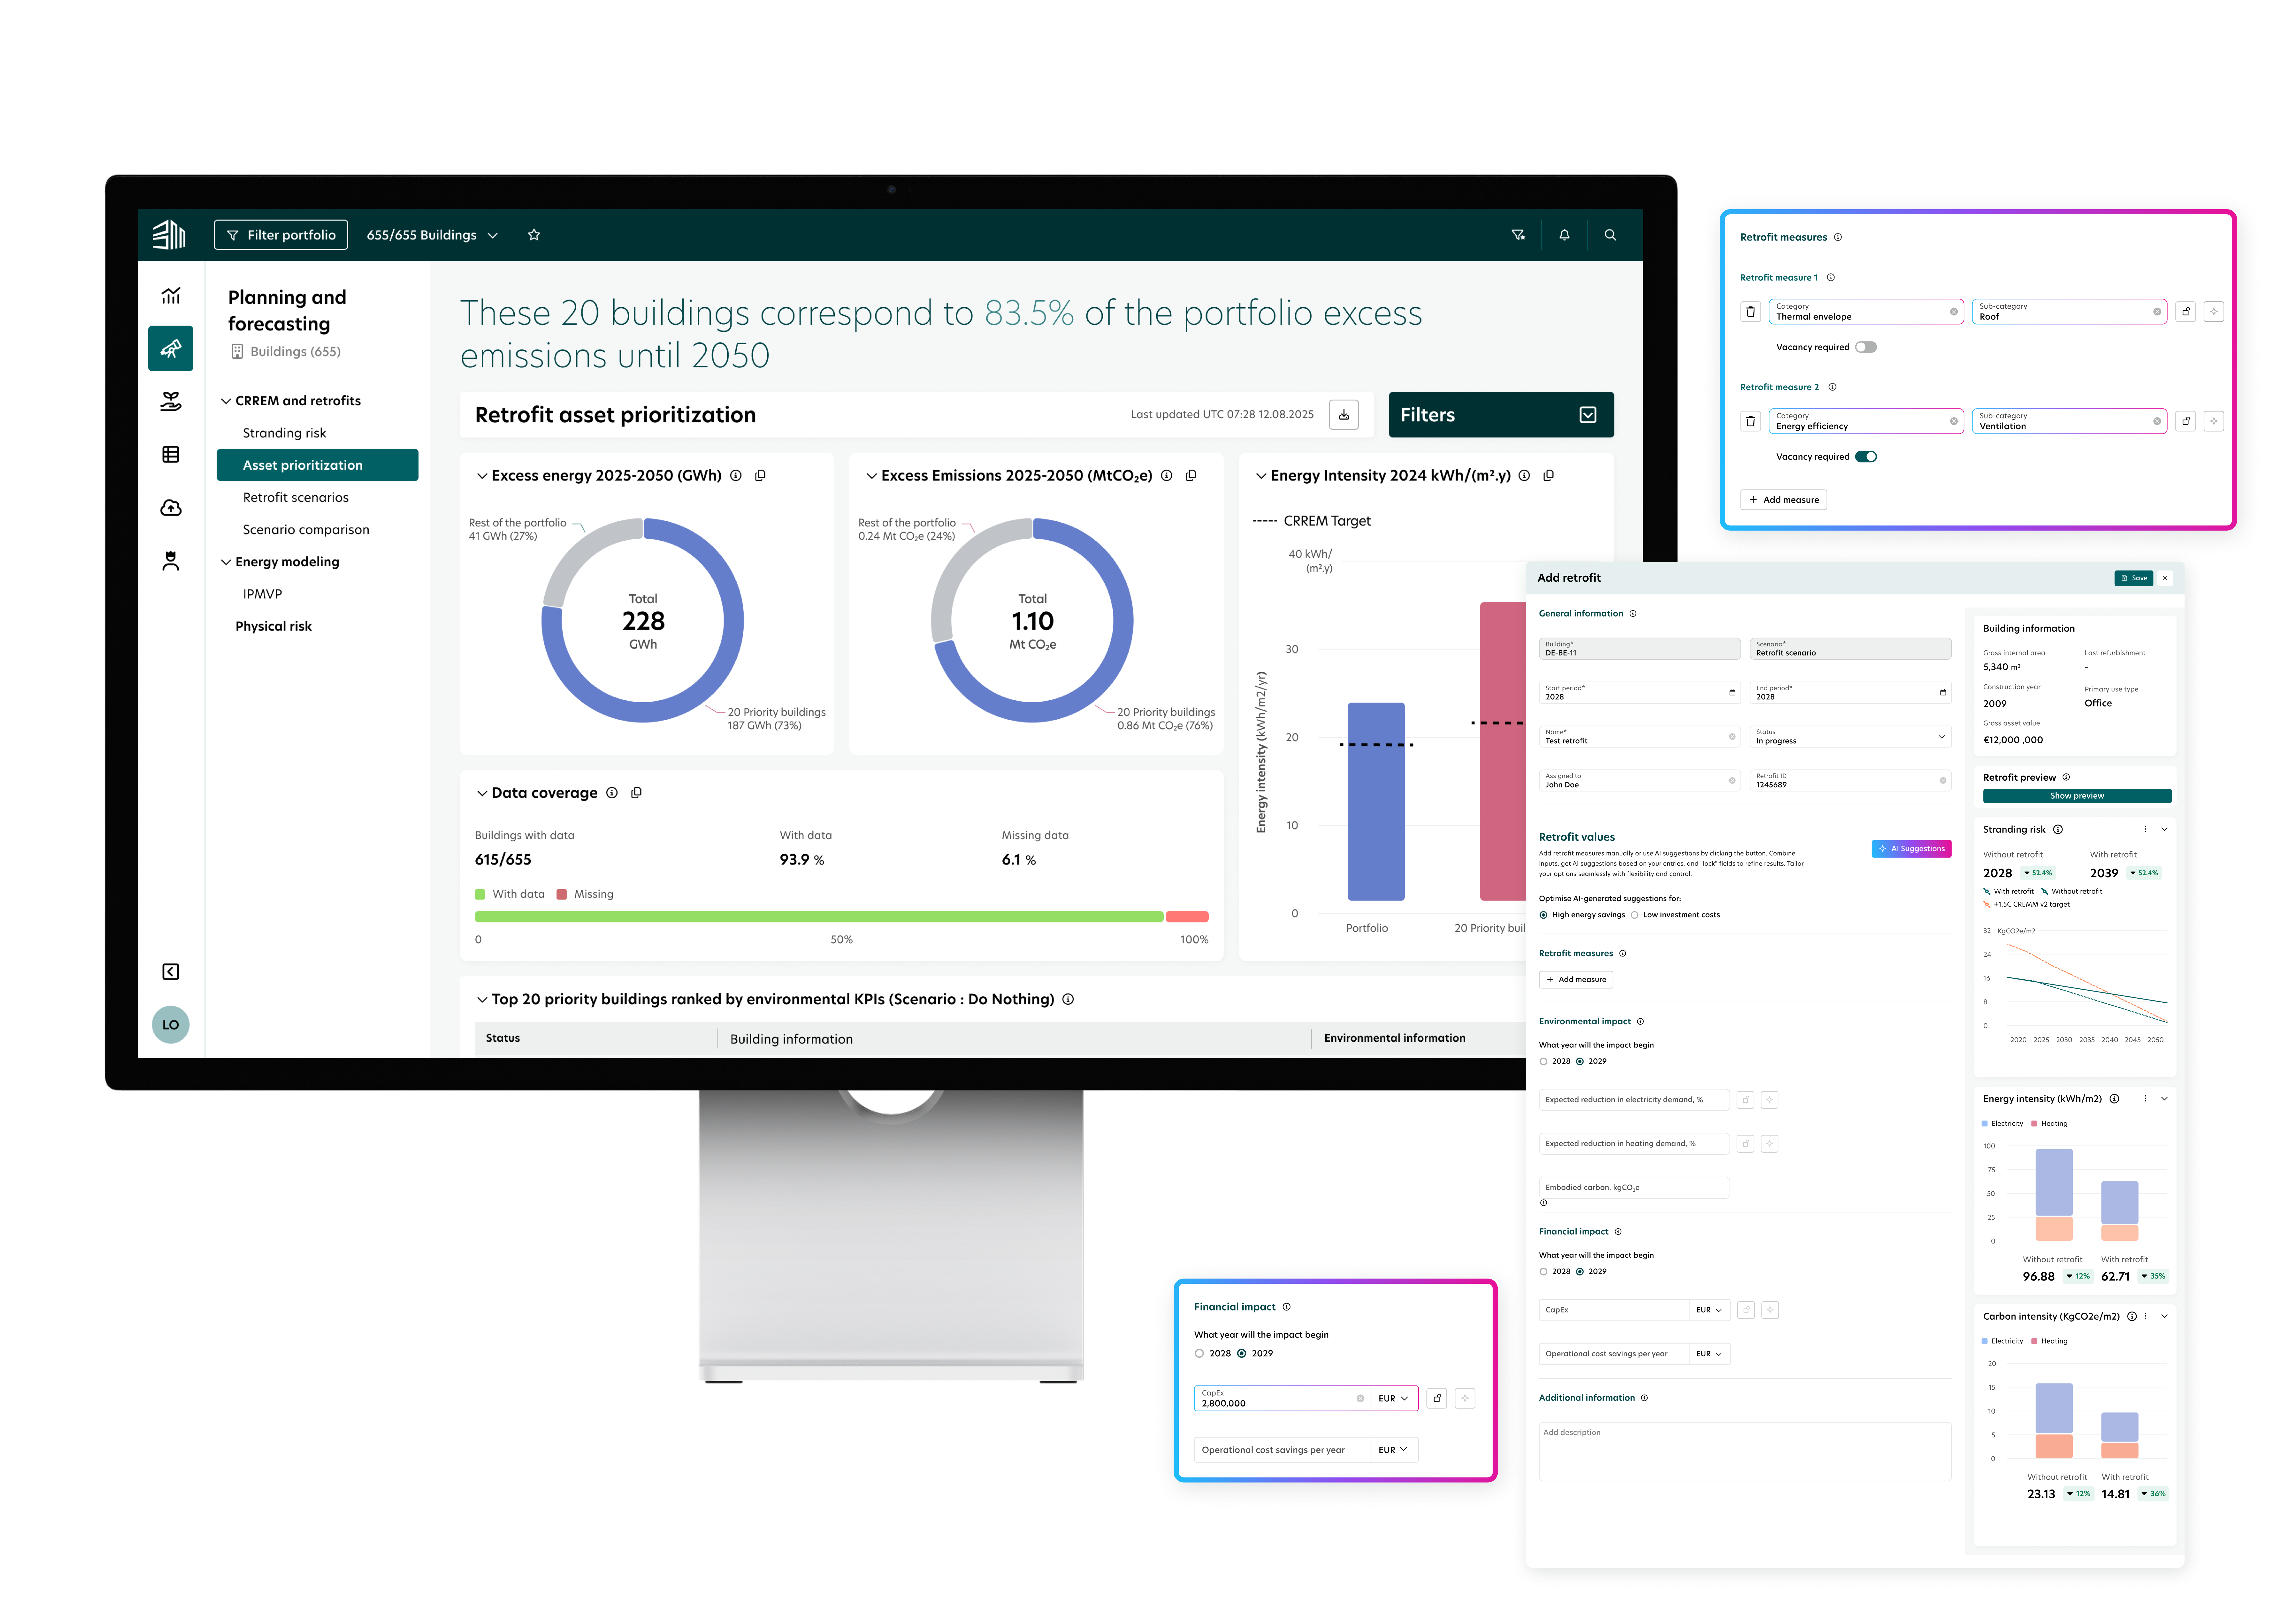
AI-powered retrofit asset prioritization

From manual entry to 30-second oversight

Utility invoices arrive in hundreds of different formats across hundreds of buildings. AI extraction removes the manual transcription step — automatically identifying service periods, consumption units, and billing line items from unstructured documents.

High-certainty extractions appear pre-filled and quiet. Low-confidence fields are flagged for human review. Every extraction is linked to its source image, creating a full audit trail for regulators.
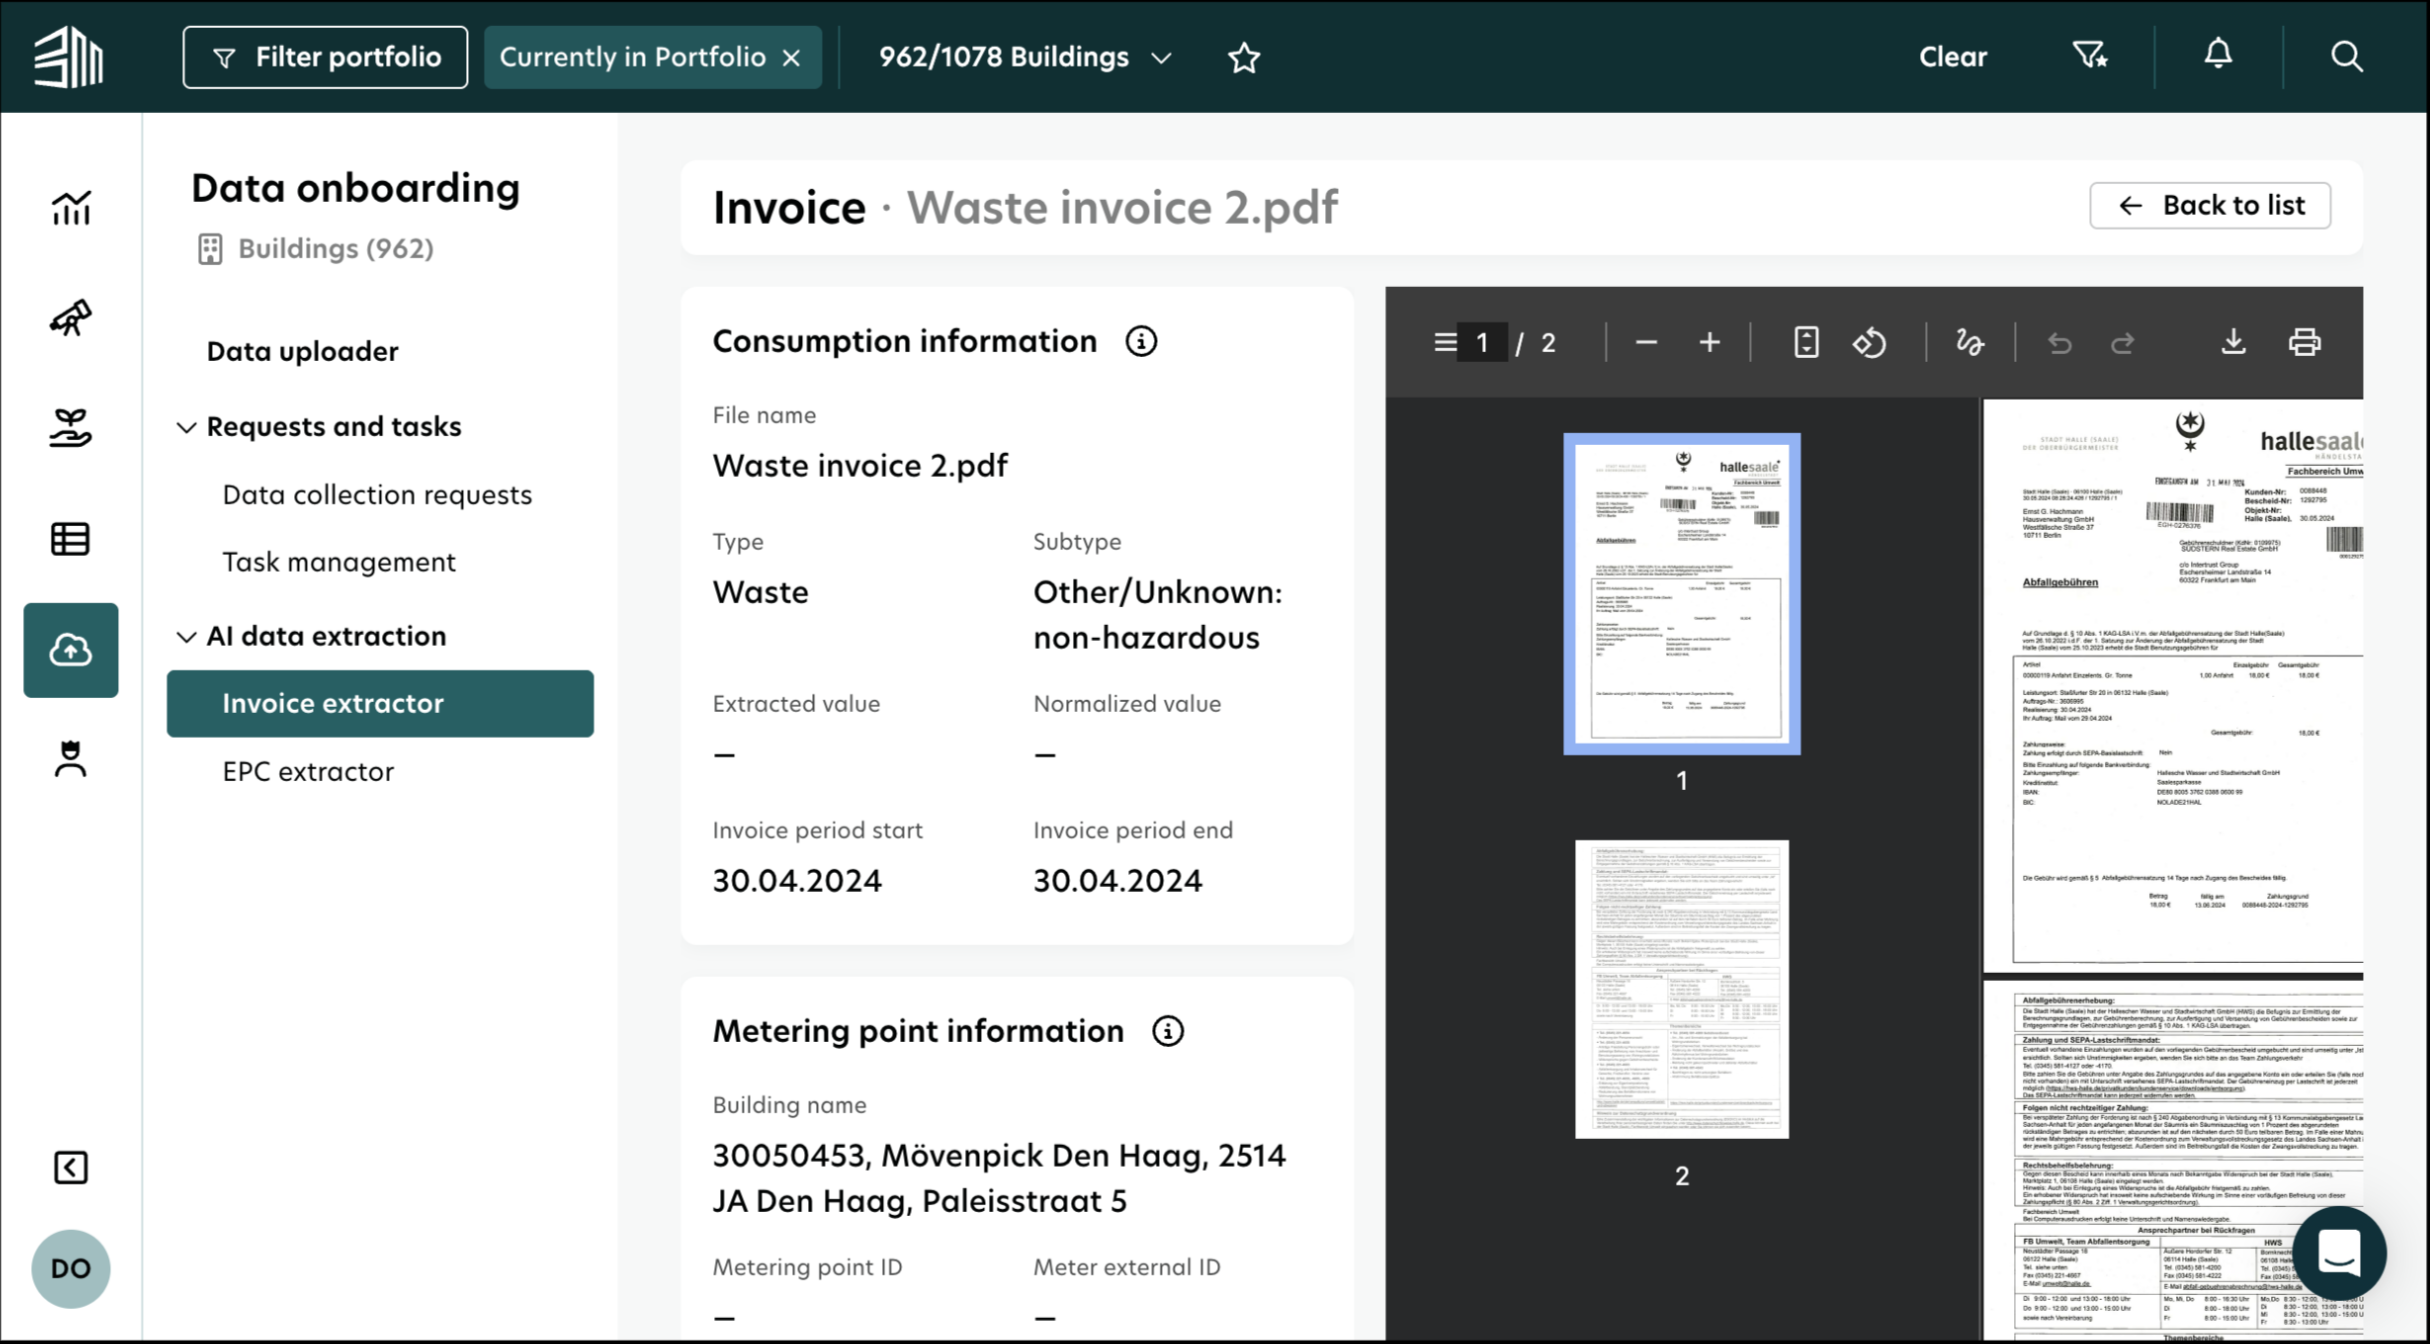
app.buildingminds.com/buildings/documents
AI invoice extraction interface
Features & Execution

What we built, and why it matters

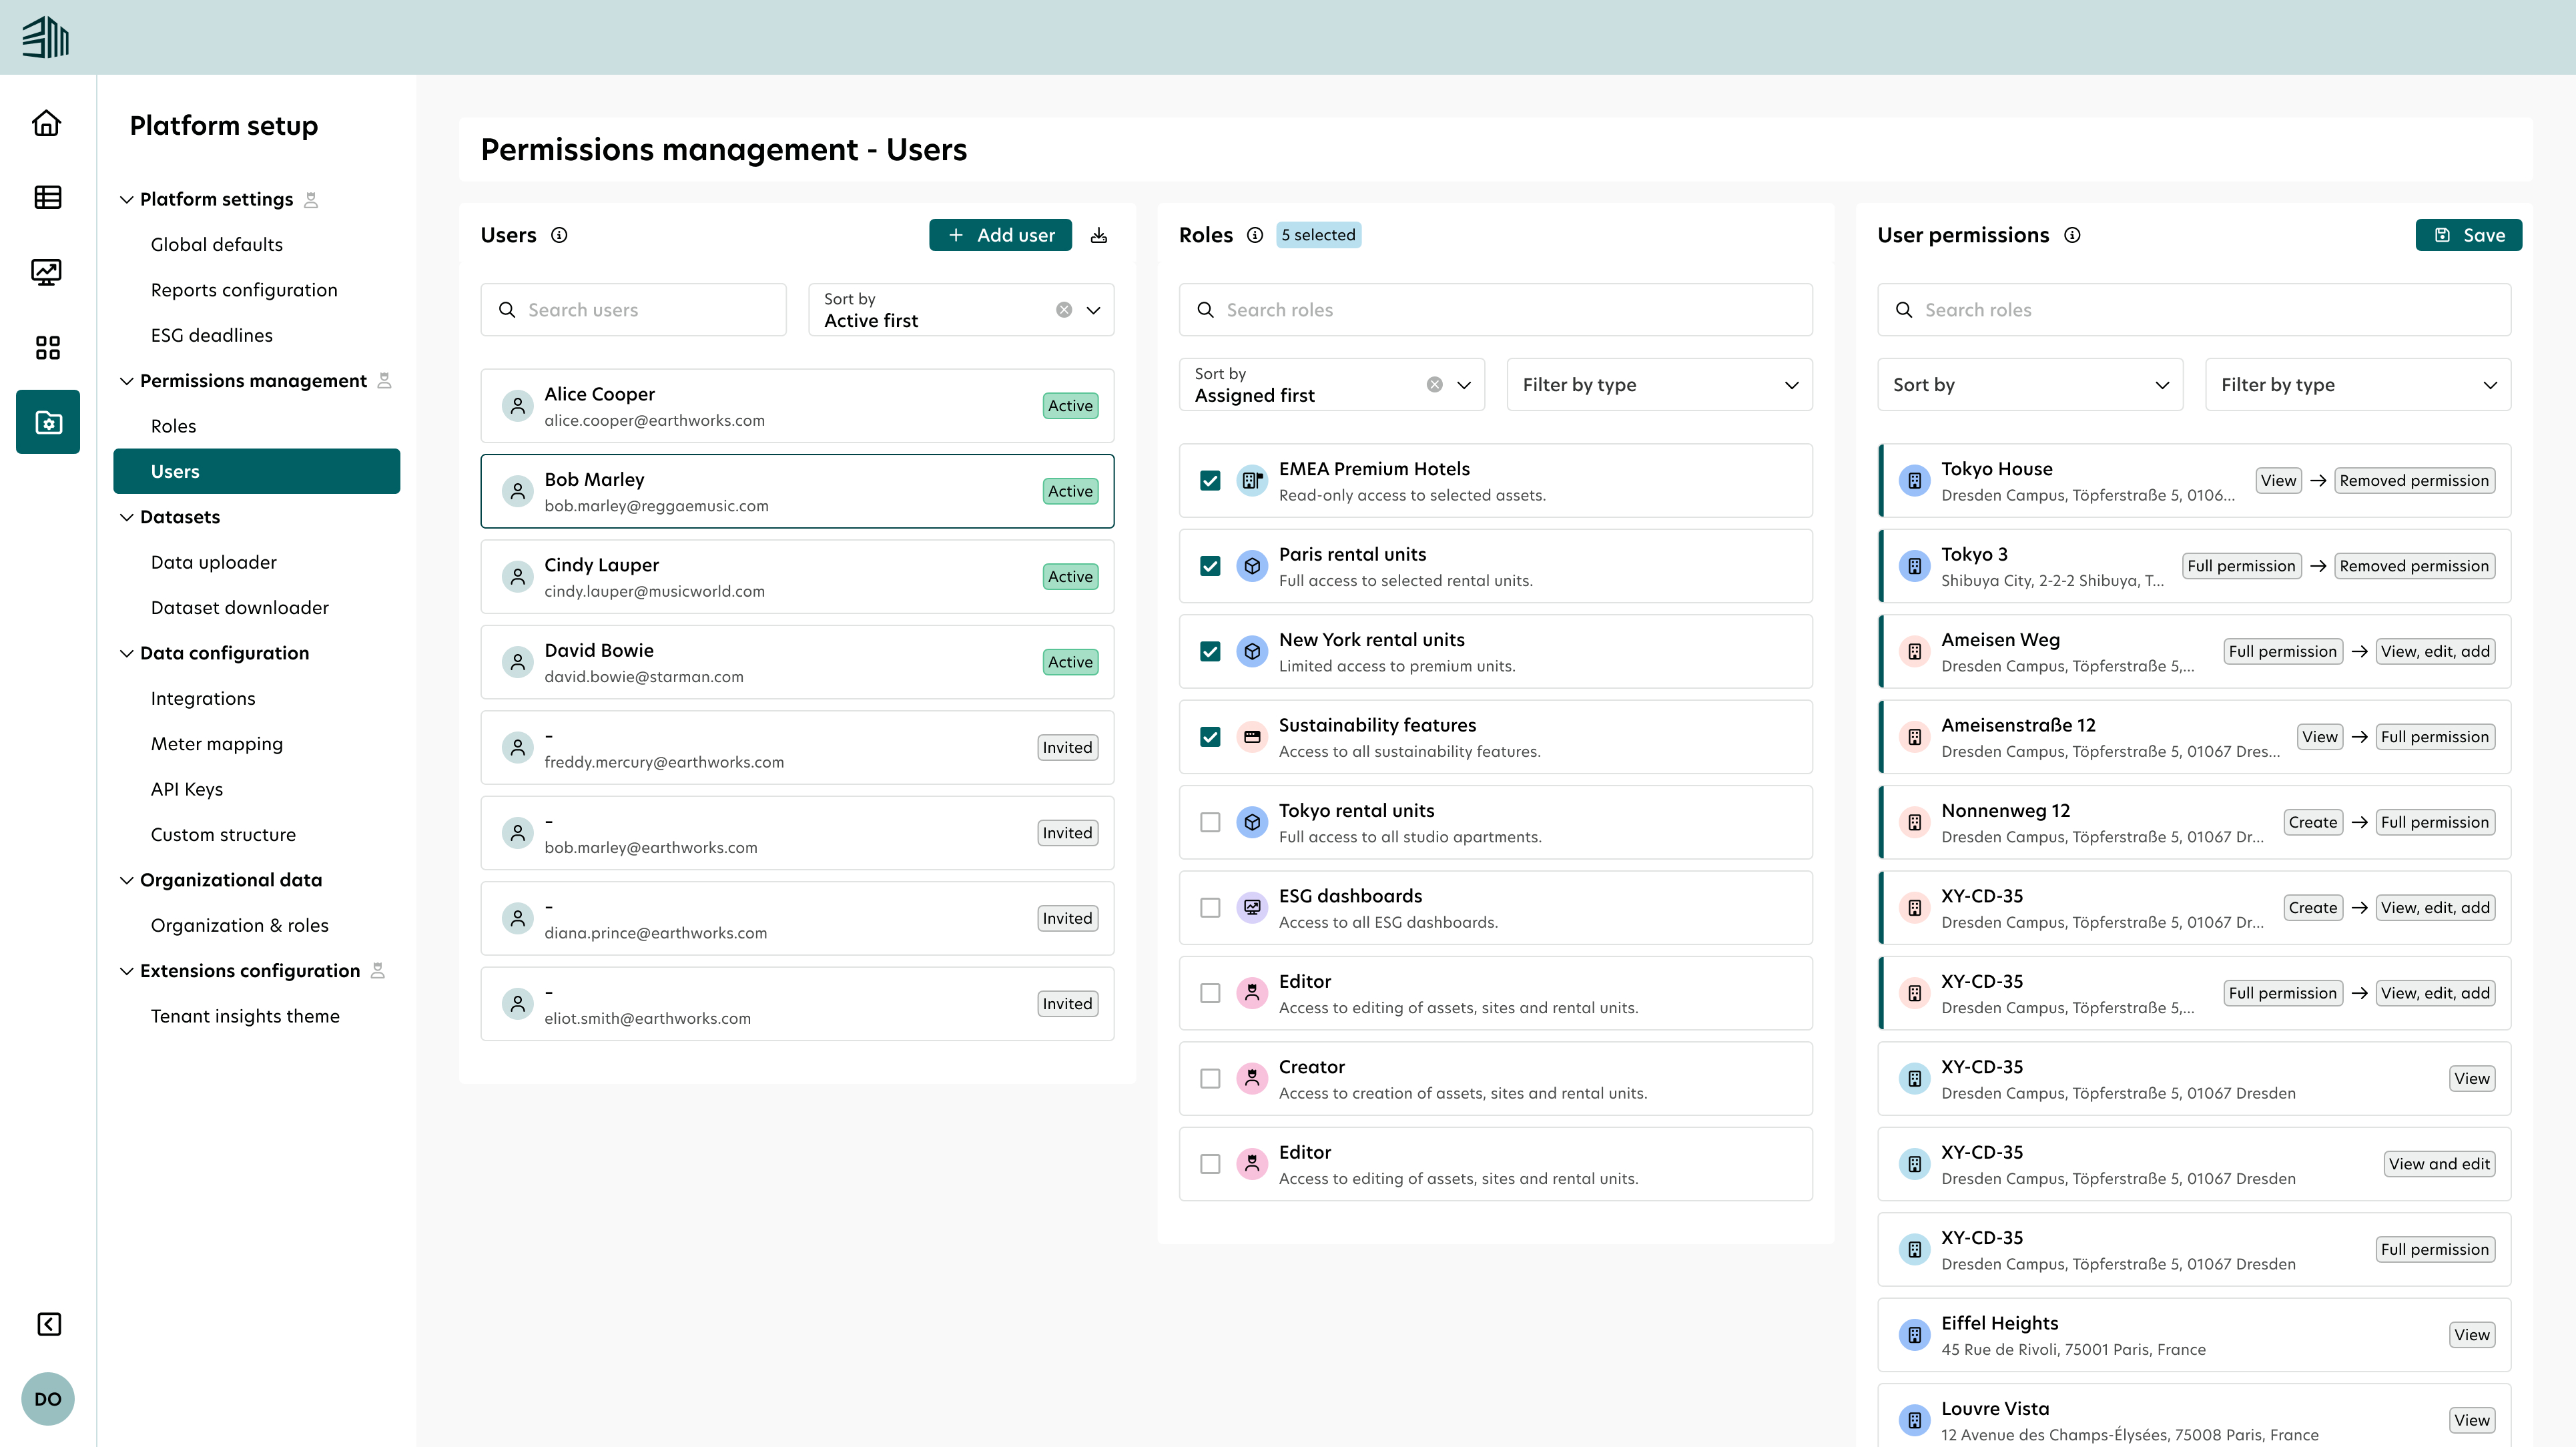
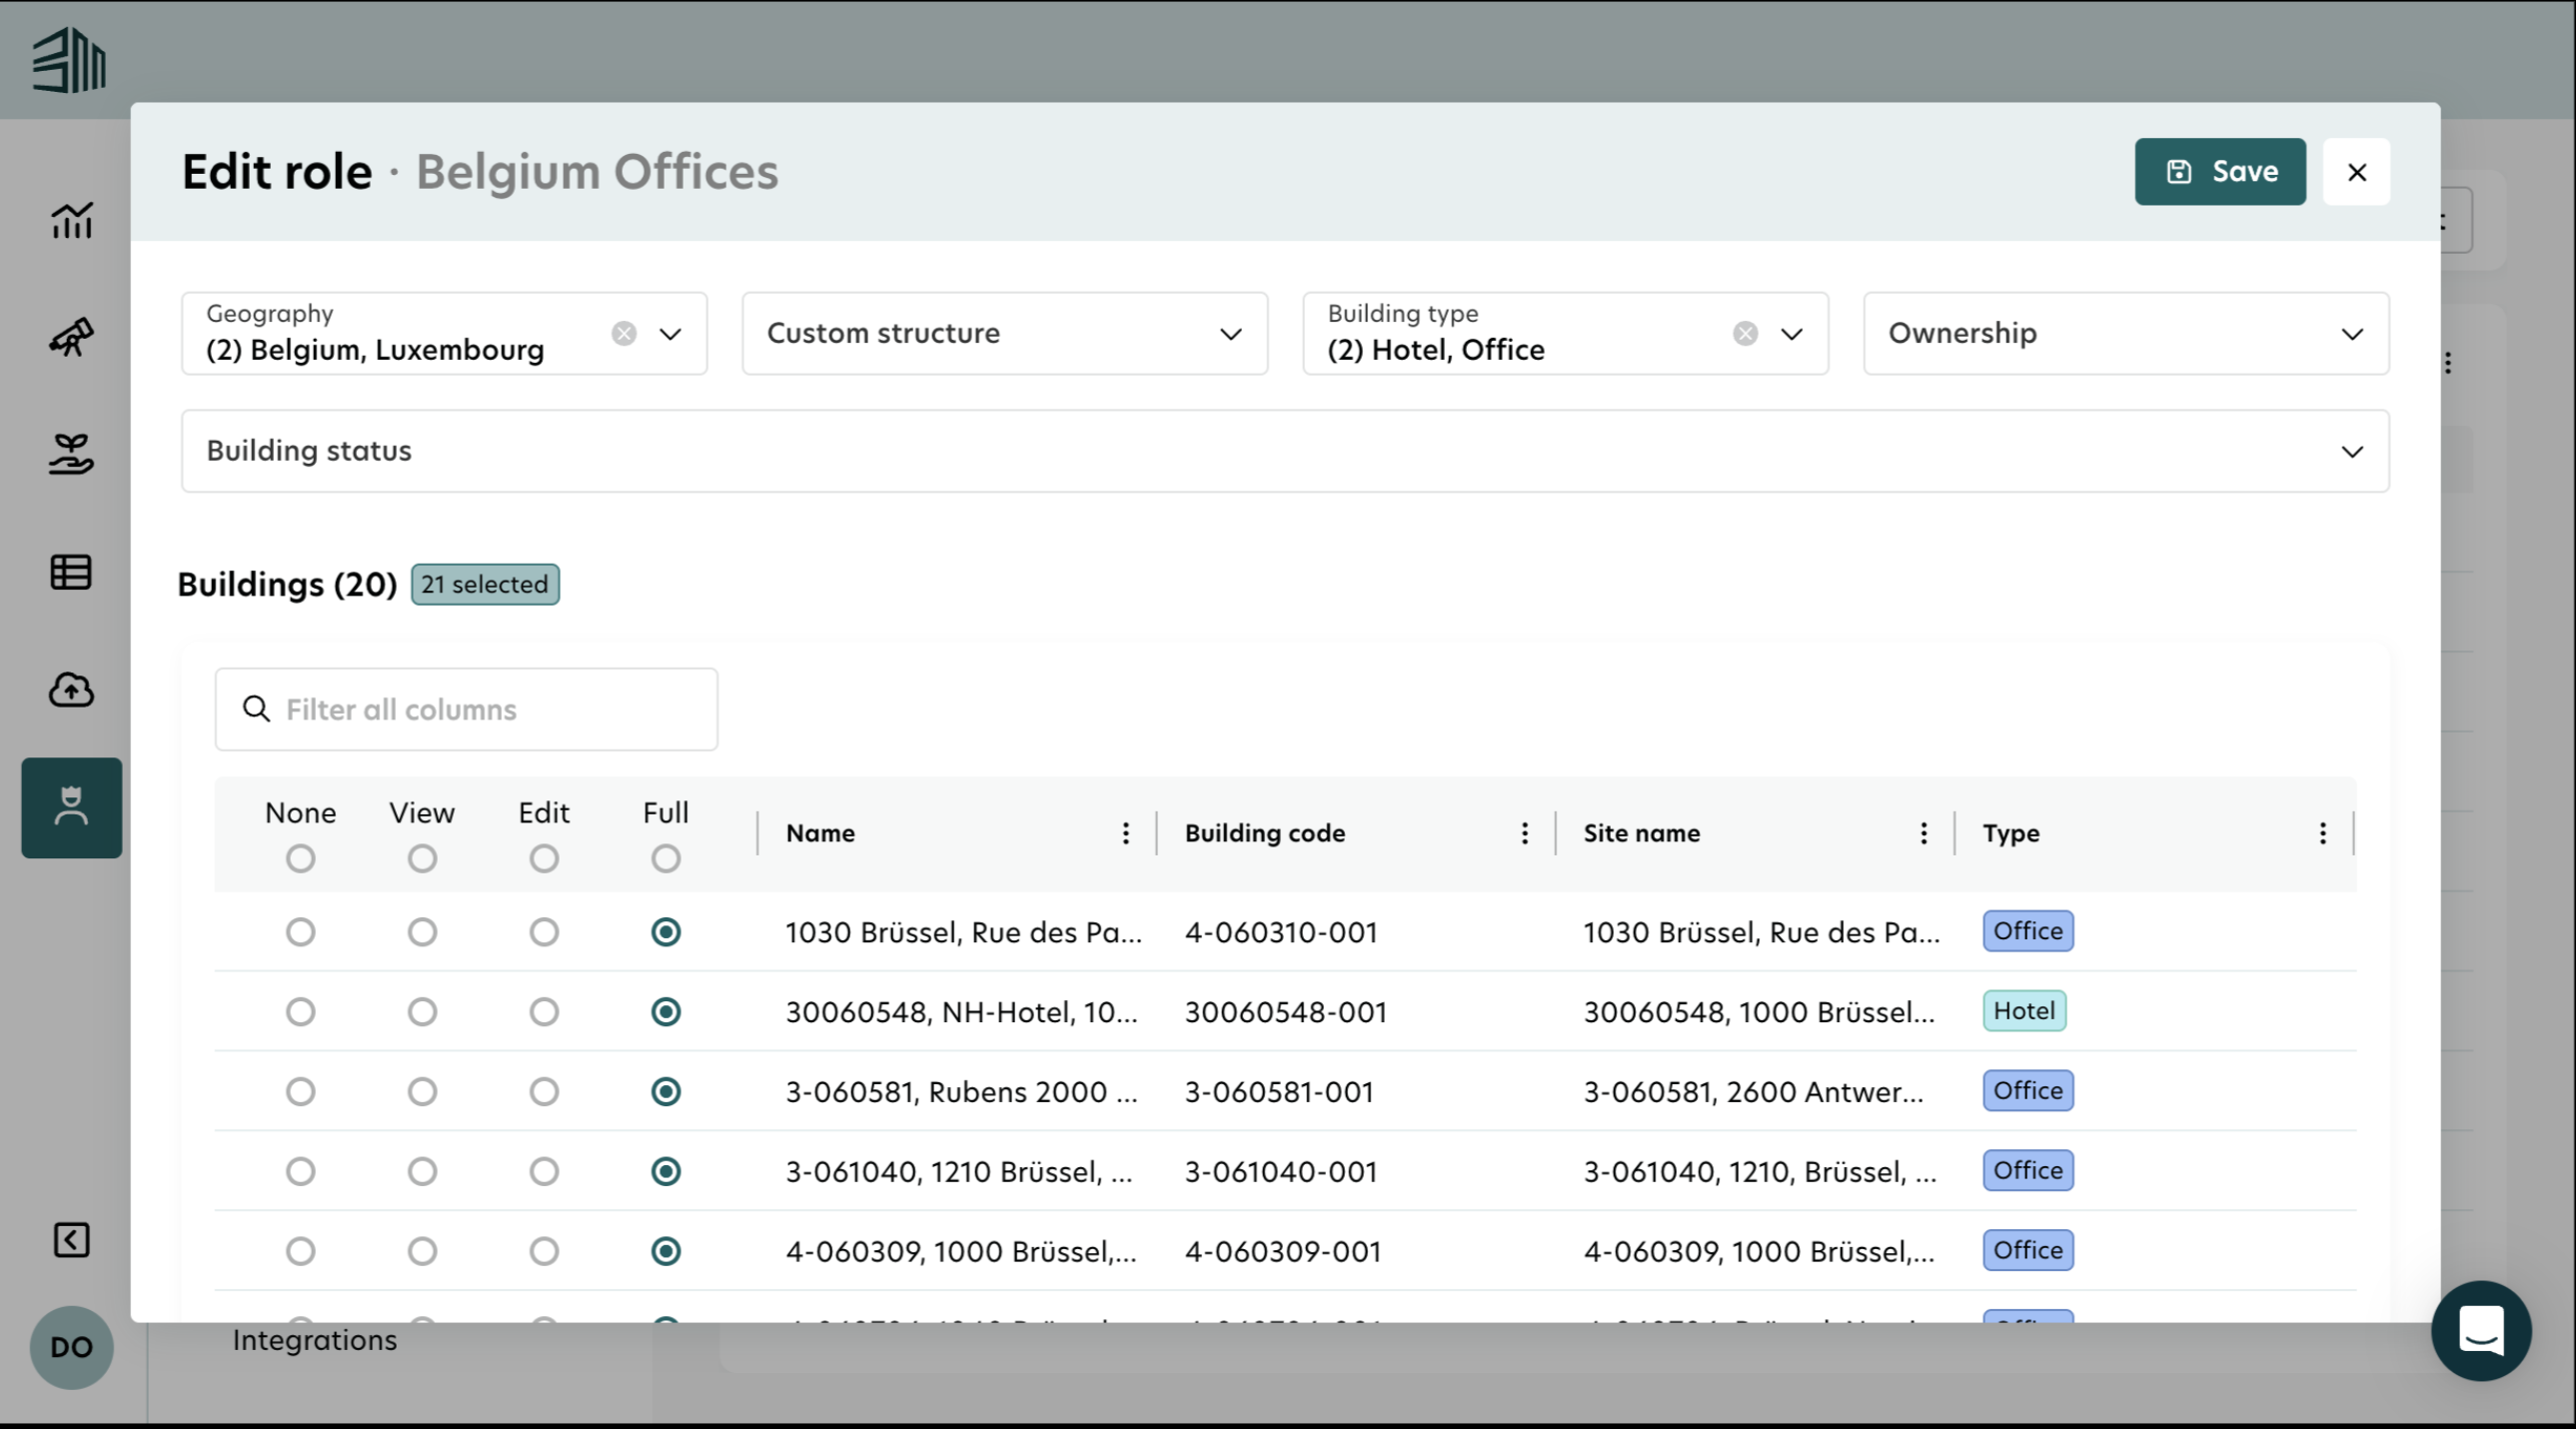
01 · Permissions & User Roles

The right data, for the right person

Energy use and environmental impact become trackable across building portfolios. Consumption pattern analysis reveals inefficiencies and improvement opportunities. With rising energy costs impacting profitability, this clarity enables strategic management that reduces expenses while lowering carbon footprint.
app.buildingminds.com/settings/permissions
User permissions UI displayed on a desktop computer monitor
Permissions Overview
app.buildingminds.com/settings/roles/edit
Edit roles UI displayed on a desktop computer monitor
Role Editor
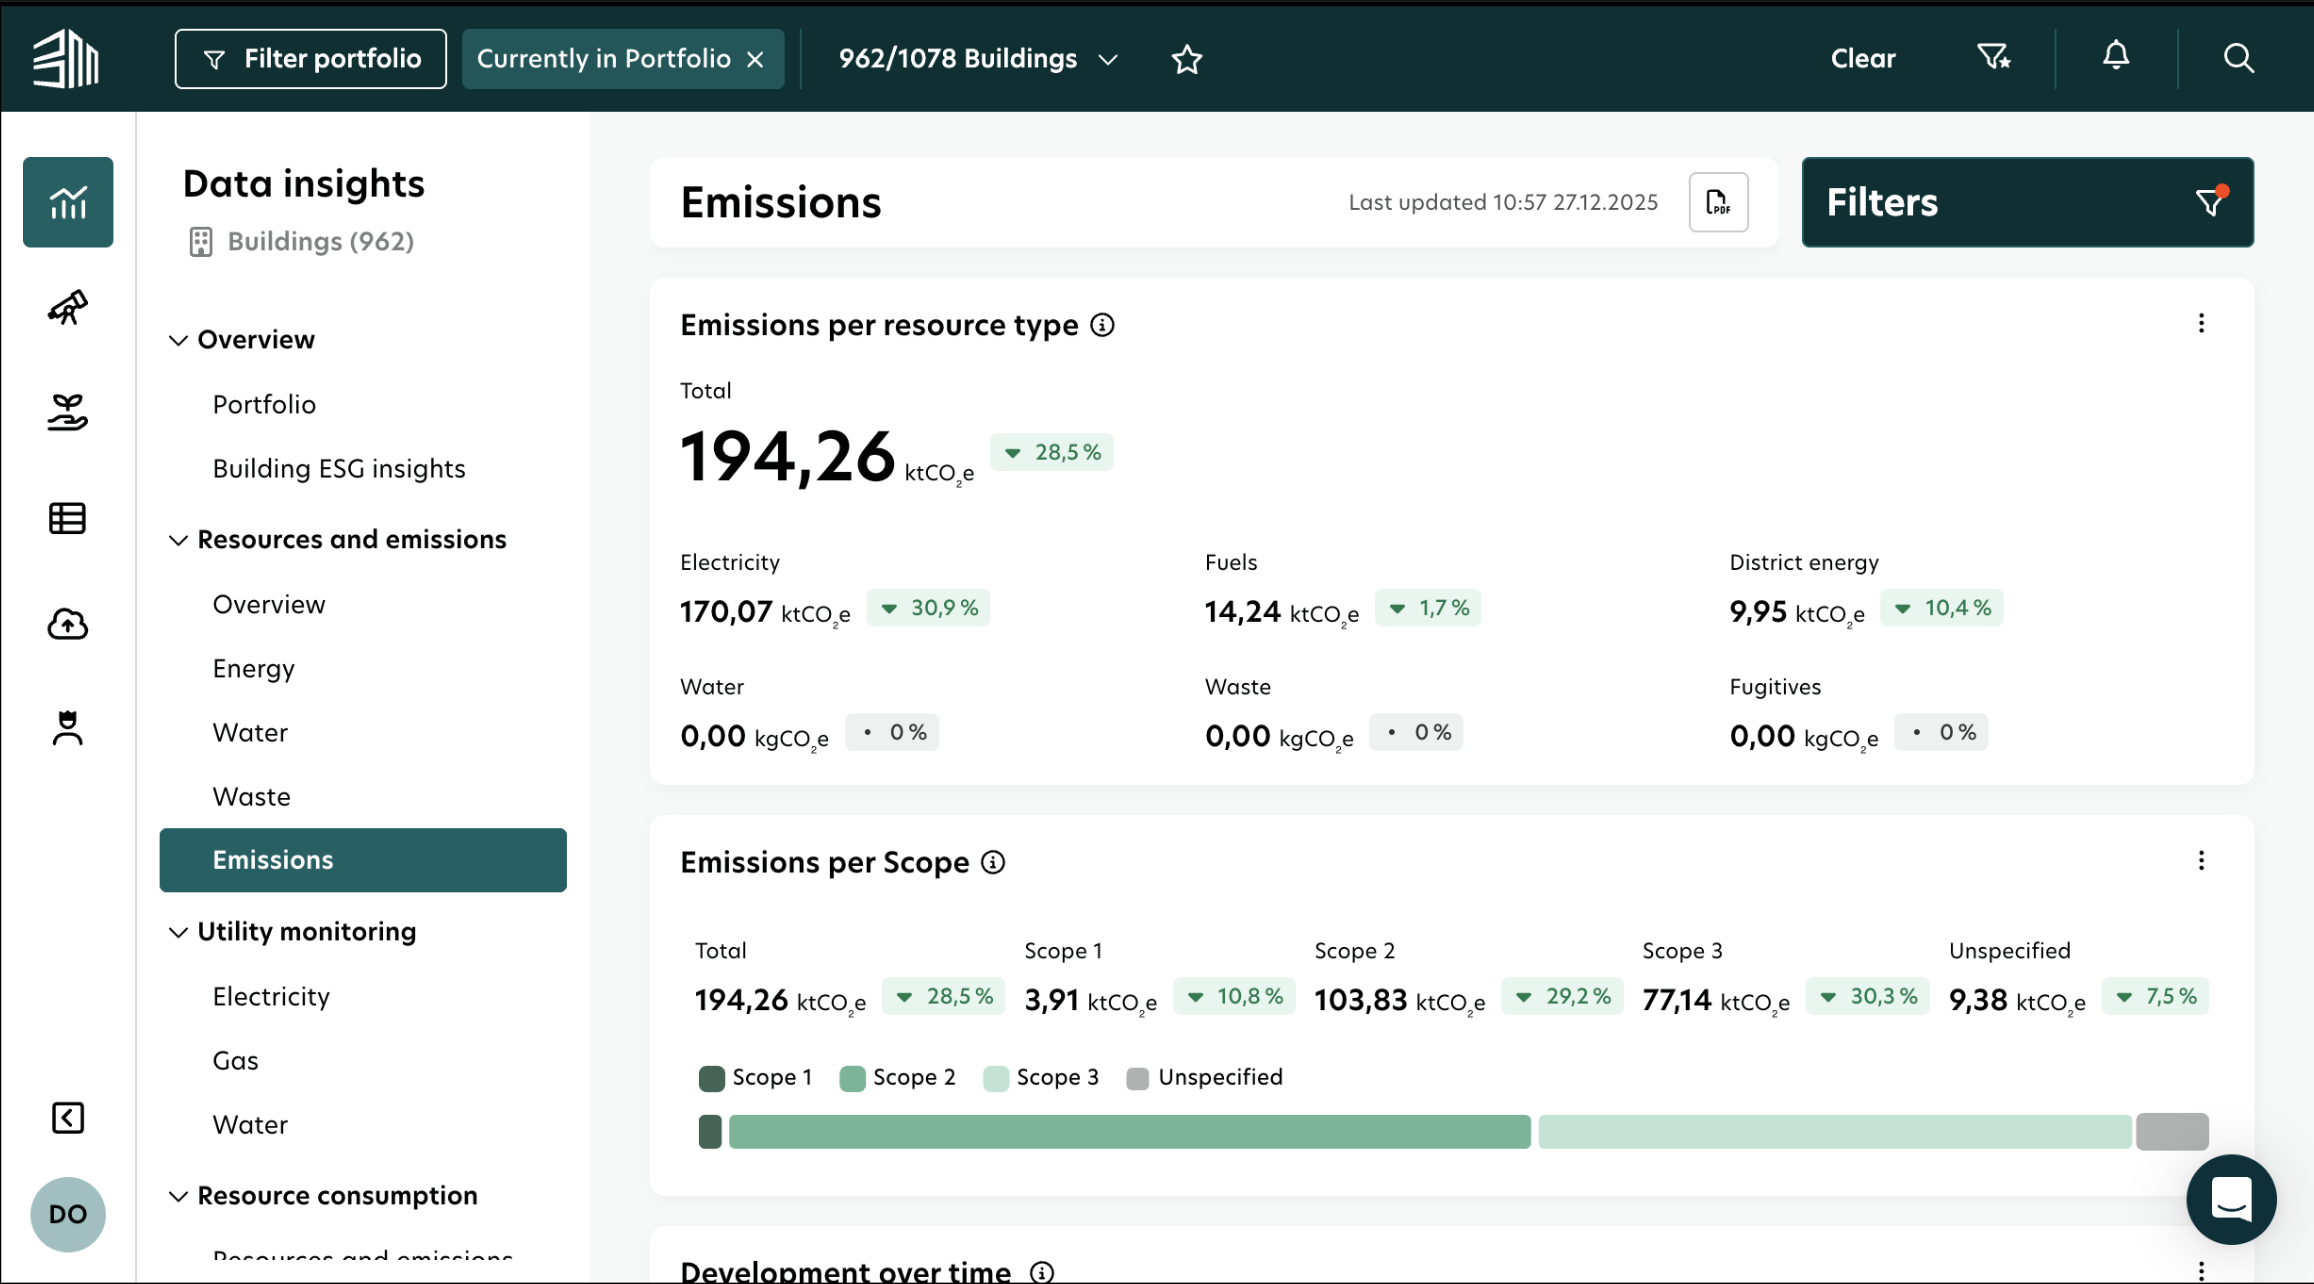
02 · Energy and Carbon Optimization

Consumption patterns that reveal what to fix

Energy use and environmental impact become trackable across building portfolios. Consumption pattern analysis reveals inefficiencies and improvement opportunities. With rising energy costs impacting profitability, this clarity enables strategic management that reduces expenses while lowering carbon footprint.
app.buildingminds.com/emissions
Emissions tracking dashboard displayed on a desktop computer monitor
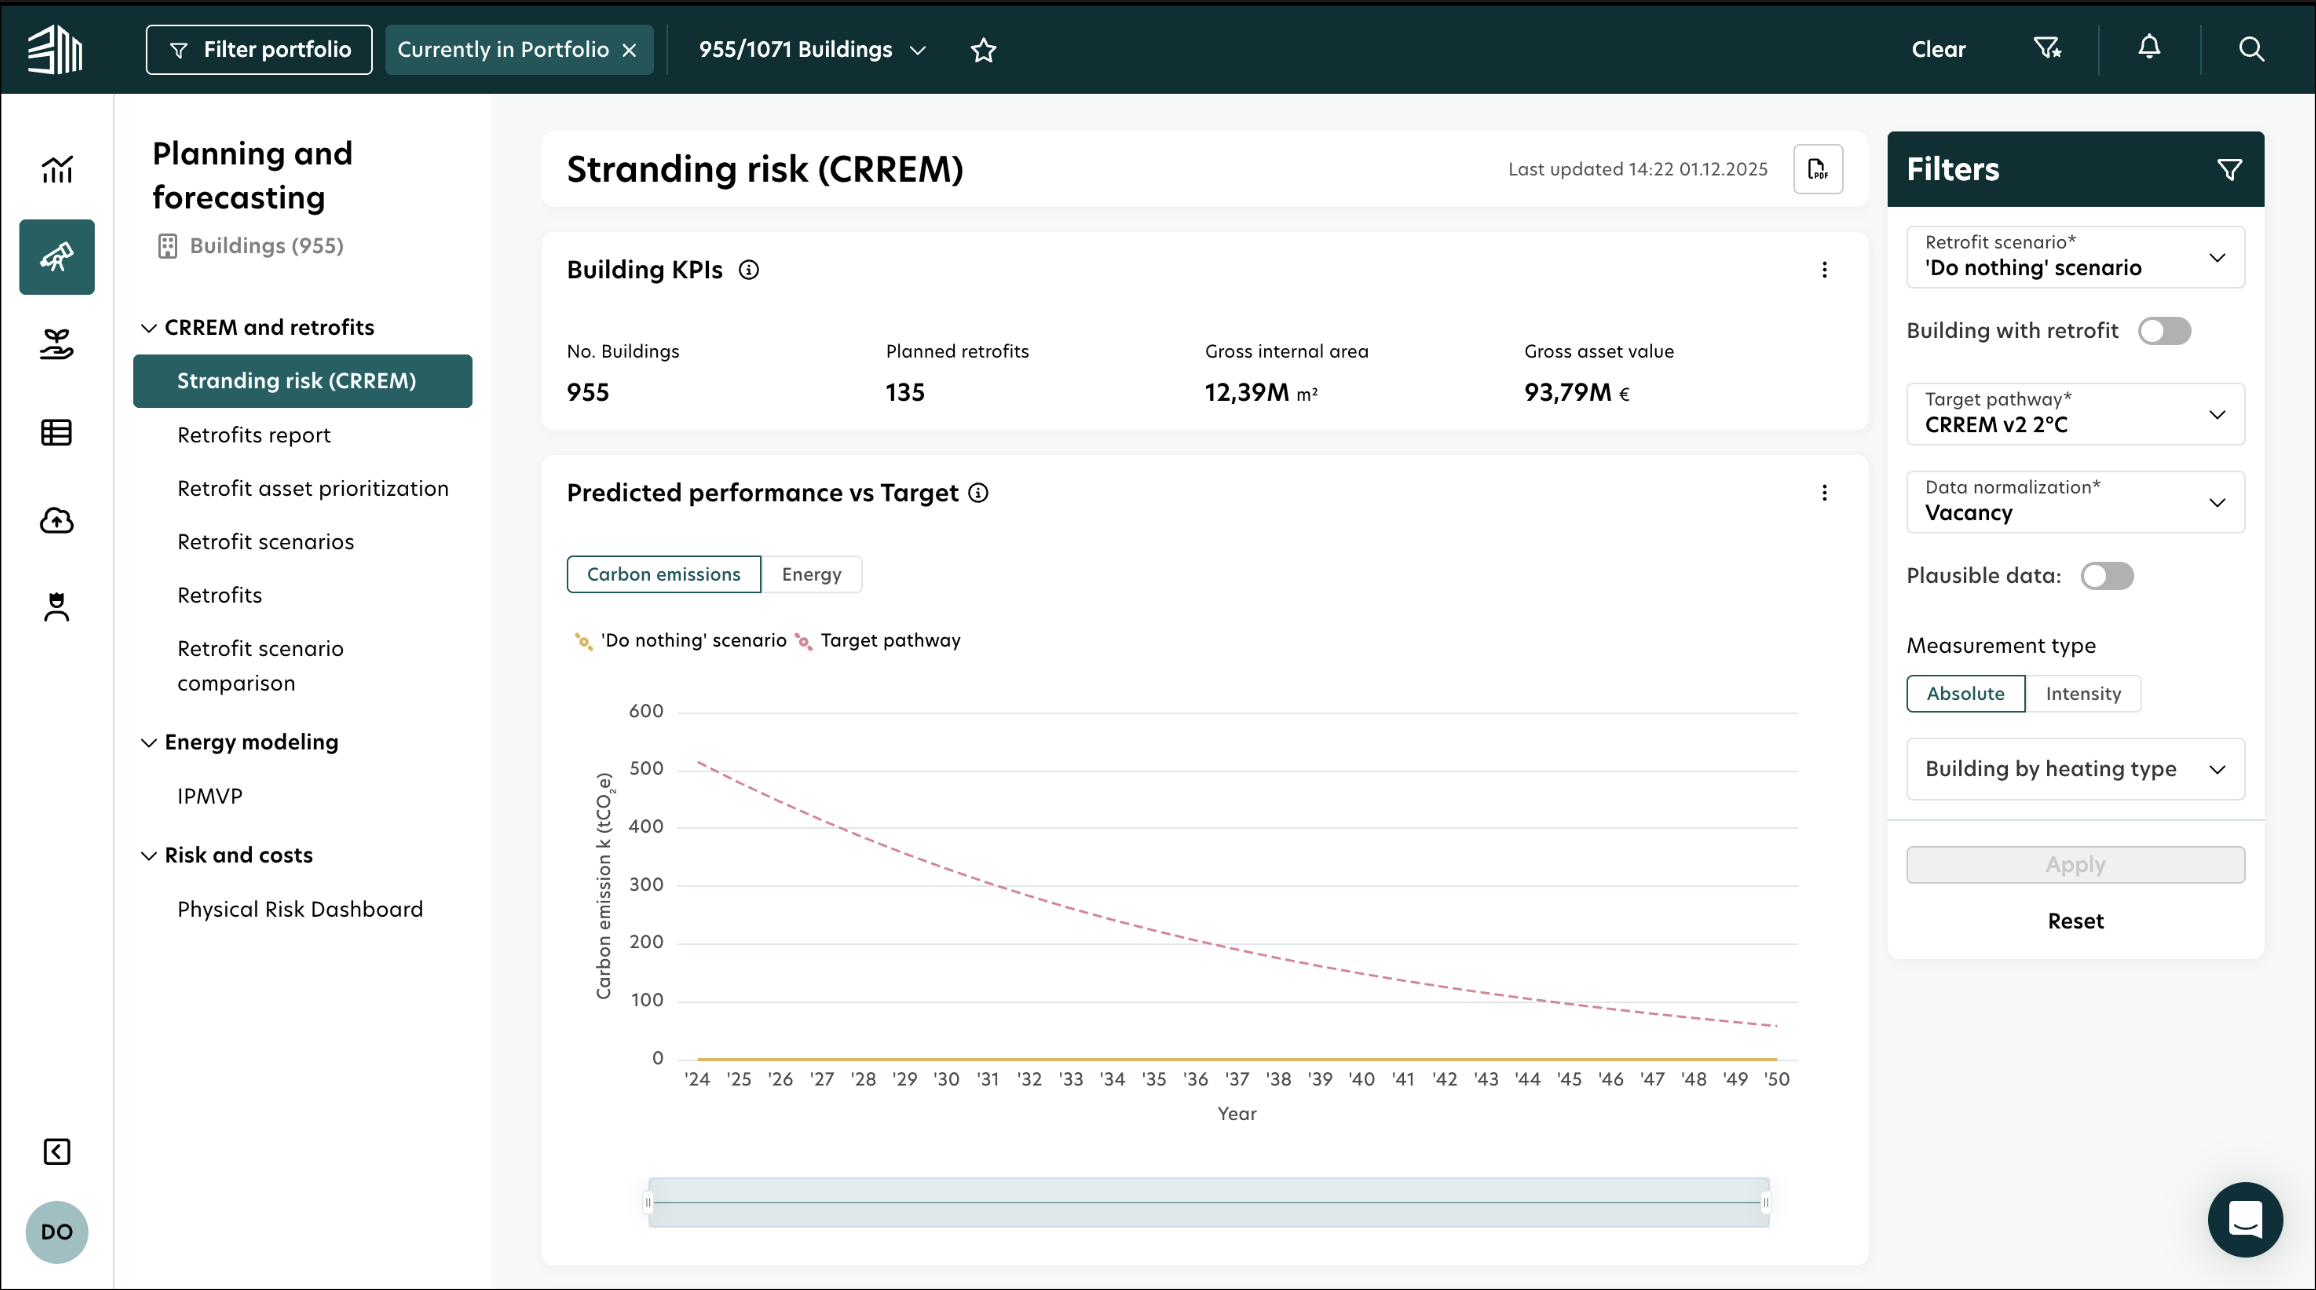
03 · Decarbonization Planning

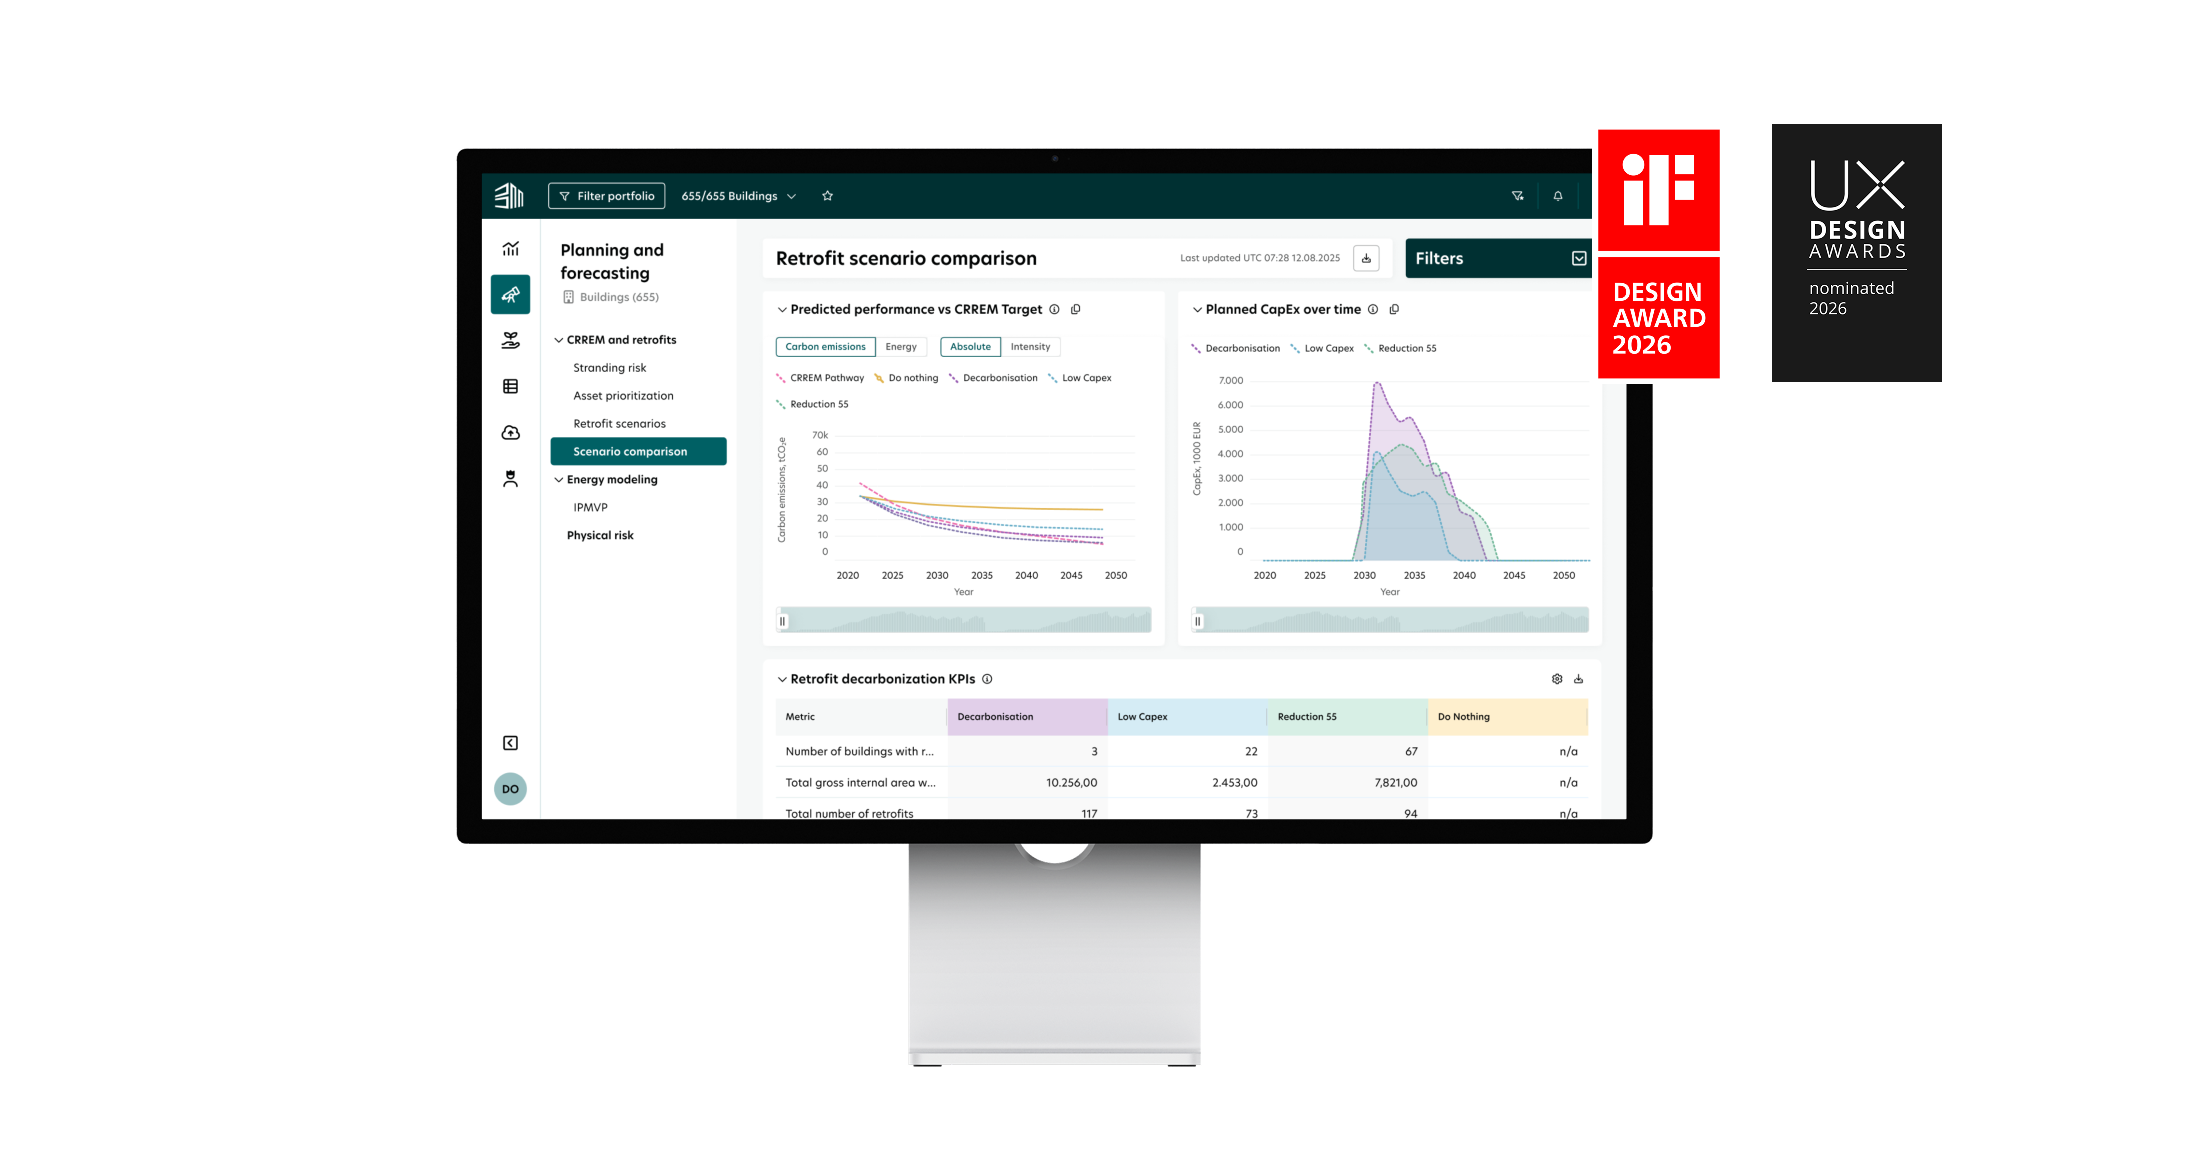
Retrofit investments that pay off twice

Building retrofit planning reveals costs, benefits, and optimal sequencing. Investment decisions are informed by environmental impact and financial return analysis, ensuring upgrade strategies deliver sustainability improvements while maintaining strong economic performance and asset value.
app.buildingminds.com/risk/stranding
Stranding risk and retrofit planning UI displayed on a desktop computer monitor
04 · Sustainable Finance Regulation (SFDR)

Compliance that attracts the right investors

Carbon risk is measured, properties benchmarked against climate targets, and sustainability performance validated transparently. This attracts climate-conscious investors, ensures regulatory compliance, and protects asset values from devaluation as environmental standards shape real estate markets.
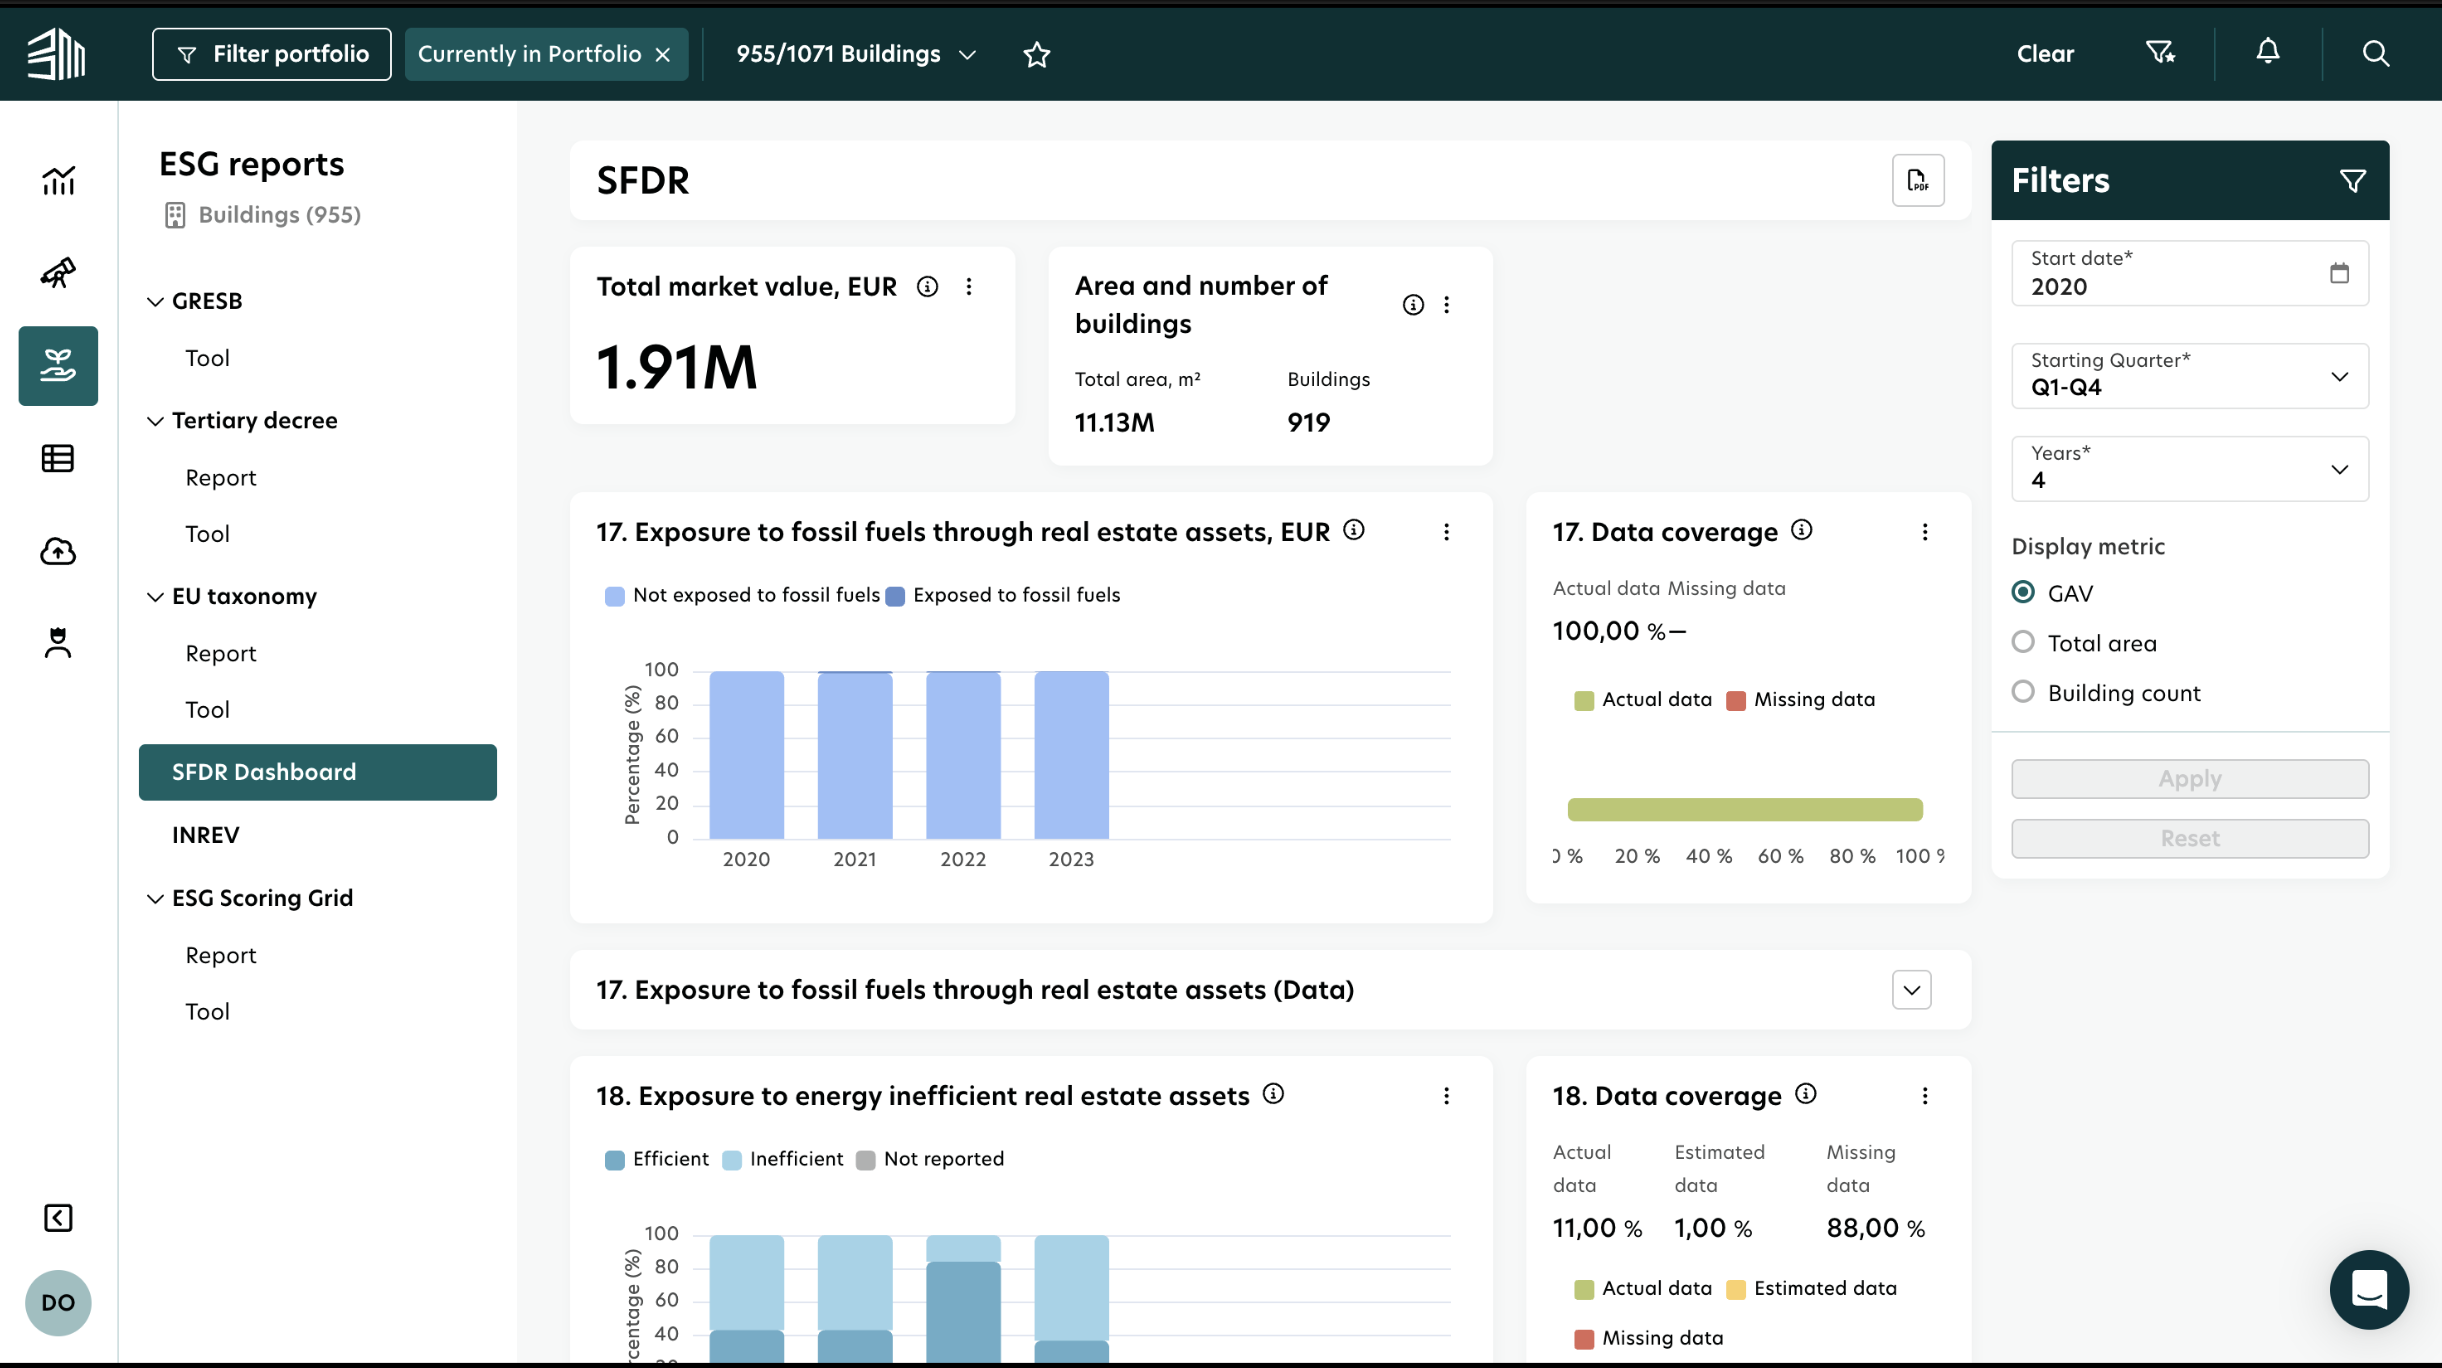
app.buildingminds.com/compliance/sfdr
Regulatory compliance and SFDR benchmarking dashboard displayed on a desktop computer monitor
05 · Utility Monitoring

Every kilowatt, accounted for

It tracks real-time energy, water, and resource usage across properties to detect anomalies, optimize consumption, control costs, and improve operational efficiency.
app.buildingminds.com/energy
Real-time utility monitoring metrics displayed on a desktop computer monitor
06 · AI Invoice Extraction

From manual entry to 30-second oversight

From Typing to Verifying: Instead of a blank form, users interact with AI-extracted data. The AI does the heavy lifting, identifying service periods and consumption units across diverse invoice layouts.

Confidence-Driven Design: The UI highlights AI certainty. High-confidence data stays quiet, while low-confidence areas are flagged, directing the user's eye only where human intervention is needed.

Audit-Ready Intelligence: The AI creates a persistent digital link between the extracted value and the source image, making the workflow 100% transparent for auditors.

Impact: Moving from manual toil to AI orchestration transformed a 10-minute administrative chore into a 30-second oversight task.

app.buildingminds.com/buildings/documents
AI-assisted invoice data extraction workflow displayed on a desktop computer monitor

What shipped, what changed

The redesigned platform launched to a cohort of 12 enterprise clients across Germany, the Netherlands, and the UK. The portfolio overview became the primary entry point for 91% of daily sessions within the first month, validating the IA restructure.

Reporting time dropped by 10–50% depending on portfolio complexity. Sustainability officers who previously spent two weeks compiling SFDR disclosures completed the same task in 3–4 days using the new compliance module.

The data provenance feature addressed the trust gap directly. Qualitative feedback from follow-up interviews described the platform as "finally feeling reliable" and "the first tool where we actually trust the output enough to put it in a board deck."

"The hardest design problem wasn't the complexity. It was convincing stakeholders that less information, shown better, would drive more confident decisions."

Personal reflection on the project
Read more of my work
Case Study · BuildingMinds
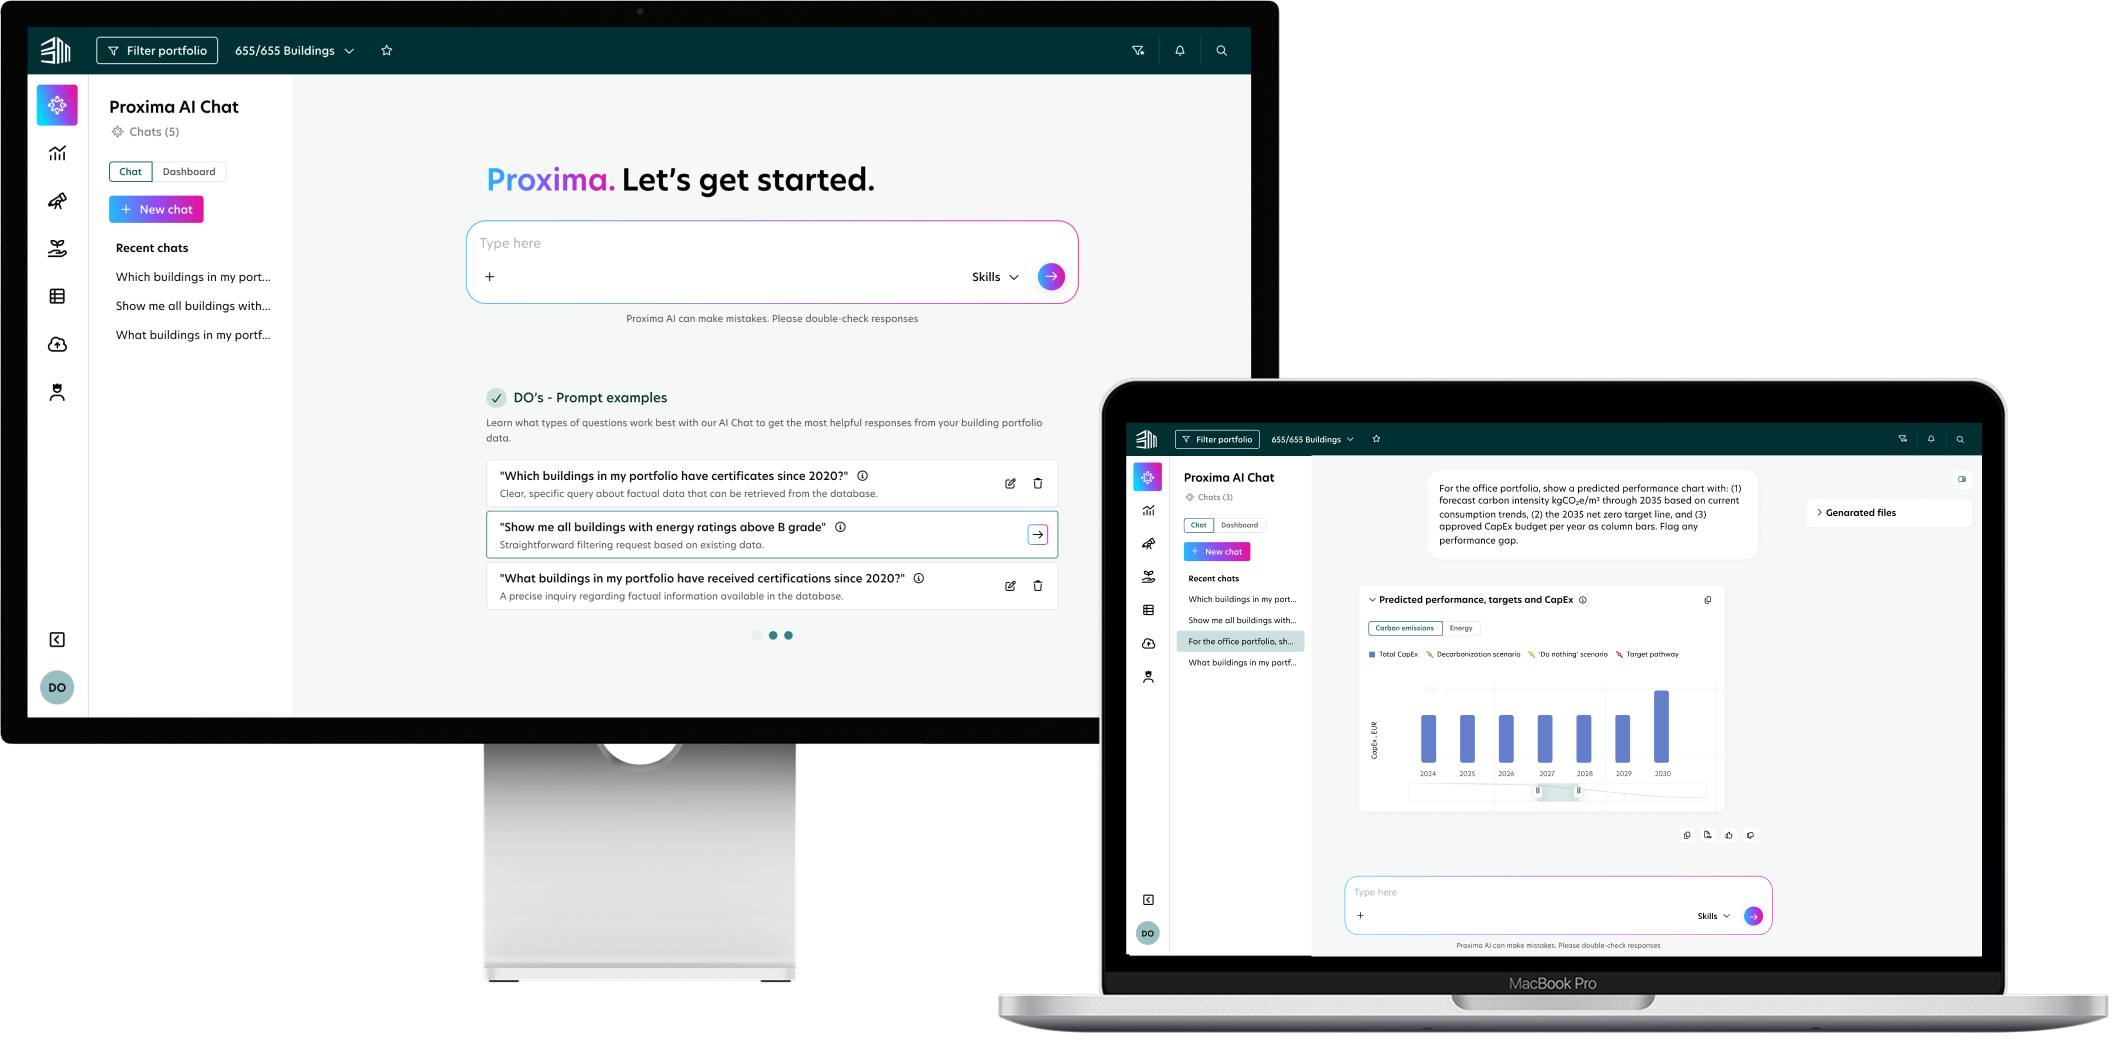
Proxima AI Chat
Proxima AI Chat
View Work
Case Study · BuildingMinds
AI-Powered Retrofit Planning
View Work
Case Study · Proxima
BuildingMinds Platform
From Hackathon to Platform
View Work